

When an MS Genetic Score Is Not One Number
A polygenic risk score arrives as a single number, and most multiple sclerosis (MS) studies use it that way: one value per person, entered as a covariate or cut into tertiles. Three 2026 papers each find that the single number is not the useful unit. In the first, four separate genomic scores predict nothing about disability on their own, and the same four predict a great deal once patients are clustered on them. In the second, the effect of a daily supplement on MS risk is absent at one end of the score's range and halved at the other. In the third nobody measures the genome at all, and three diagnoses already written in the chart separate the inflammatory protein profiles.
Four Scores That Predicted Nothing
Kreft and colleagues worked with 1,455 patients from the South Wales MS Registry, a cohort running since 1985 with annual assessments, and with 272 post-mortem confirmed MS donors from the Netherlands Brain Bank as an independent cohort. They built weighted genomic risk scores from the largest MS susceptibility study and from the two most recent progression studies, plus a separate HLA burden score, assigning each variant to exactly one score so that nothing was counted twice. Tested one score at a time, none showed a consistent association with time to a disability score of 4, 6 or 8, or with the onset of secondary progressive disease. That null agrees with an earlier attempt to forecast severity from susceptibility variants, and it is the ordinary result: a summed score built to predict who gets the disease does not predict how the disease goes.
The Same Scores, Clustered
Hierarchical clustering on those same scores, with no clinical input, split the patients into three groups at an agglomerative coefficient of 0.97. The groups did not differ on any baseline measure at onset. They differed afterwards. Against cluster 1, clusters 2 and 3 reached the need for a walking aid at hazard ratios of 1.32 (p = 0.009) and 1.46 (p = 4 × 10⁻⁵), wheelchair dependency at 1.45 and 1.49, and secondary progressive disease at 1.27 and 1.30. Relapse rate did not differ between clusters at all, with a largest effect size of 0.078 (p = 0.23), so the separation runs through disability rather than through attacks. A multi-level model on 8,941 out-of-relapse disability scores from 1,029 patients found the three trajectories tracking together for nine years and then parting, with cluster 2 gaining 0.38 more per year than cluster 1. The brain bank cohort repeated the ordering for time to a walking aid at p = 0.044.
What the Clustering Survived
Two checks carry the result. Adding four variants unrelated to MS, one per score, abolished every association with outcome, and further permutations with other random variants did the same, which is the test an unsupervised clustering result needs to pass. The clusters were then set against the clinical predictors already in use. Cerebellar onset carried a hazard ratio of 1.44 (1.15 to 1.81) for reaching a walking aid, and patients without cerebellar onset who sat in clusters 2 or 3 carried the same risk as patients who had it. Optic neuritis at onset is protective overall at 0.81, yet optic neuritis patients inside clusters 2 and 3 ran at 1.3. Treatment behaved differently by cluster as well: treated cluster 2 patients took 11.7 years longer to need a walking aid than untreated cluster 2 patients (p = 0.003), while cluster 3 showed no treatment effect on any milestone.
A Score Read Across Its Range
Nova and colleagues took a score in the other direction, as a continuous axis rather than a group label. Among 486,908 UK Biobank participants aged 37 to 70, followed for a median of 13.45 years, 452 developed MS. Regular standalone vitamin C supplementation, reported by 42,728 people at recruitment, came with a hazard ratio of 0.51 (0.32 to 0.82). The comparison was built with inverse probability weighting on a propensity score, after which every measured confounder sat below 0.1 standardised difference between users and non-users. Two negative control outcomes, transport accidents and appendicitis, returned 1.04 and 1.03. General supplement use returned 1.06 and multivitamin use 1.28, so whatever the association is, it does not extend to supplement takers as a class.
Where the Effect Sat on the Score
The genetic score was then modelled continuously with restricted cubic splines. It predicted MS, and did so non-linearly (p = 0.014), and its interaction with vitamin C was significant on the multiplicative scale (p = 0.004), driven by a non-linear component (p = 0.005). The hazard ratio for supplementation was 0.86 (0.39 to 1.41) one standard deviation below the mean of the score, 0.27 (0.11 to 0.45) at the mean, and 0.26 (0.09 to 0.41) one above. On the additive scale the interaction index came to −1.34 (−1.88 to −0.89). The authors hold this finding loosely, and the arithmetic says why: only 19 MS cases occurred among supplement users, and when the lag window for excluding early cases was widened from two years to five, the multiplicative interaction fell to p = 0.078 while the additive one held.
The Measurements Already in the Chart
Okuda and colleagues measured no genotype. They took 287 patients from one academic centre, 169 of whom carried at least one cardiometabolic diagnosis: dyslipidaemia in 127, hypertension in 123 and type 2 diabetes in 31. Among untreated patients, those with such a diagnosis had 5.48 times the odds of a relapse or new MRI activity in the preceding two years (1.18 to 25.40, p = 0.0227); among treated patients the same comparison gave 1.30 and nothing to report. The composite activity score built from an 18-protein panel did not separate the groups in either stratum, but individual proteins did: CCL20, CDCP1 and TNFRSF10A among the untreated, and CXCL9, neurofilament light, SERPINA9 and TNFRSF10A among the treated. Several rose only once a patient carried two or three diagnoses rather than one. The work is retrospective and cross-sectional, drawn from a single specialty centre, and it records which conditions a patient has without recording how well any of them was controlled. One study here found its genetic signal only after breaking the score apart, the second only after reading the score as a curve, and the third never measured a genome and still separated its groups on three lines of medical history.
Disclaimer: This blog post is based on the cited studies and is intended for informational purposes only. It is not intended to provide medical advice. Please consult with a healthcare professional for any health concerns.
References:
Kreft, K. L., Mekkes, N. J., et al., Holtman, I. R., & Robertson, N. P. (2026). Genetic subtypes associated with multiple sclerosis severity and response to treatment. Journal of Neurology, Neurosurgery & Psychiatry, 97(5), 413-421. https://doi.org/10.1136/jnnp-2025-337337
Nova, A., Fazia, T., Di Caprio, G., et al., Rondanelli, M., & Bernardinelli, L. (2026). Association of vitamin C supplementation and genetic susceptibility with multiple sclerosis risk: a prospective population-based cohort study. Nutrients, 18(14), 2367. https://doi.org/10.3390/nu18142367
Okuda, D. T., Burgess, K. W., et al., Tran, D. H., & Moog, T. M. (2026). Cardiometabolic disease is associated with distinct proteomic signatures of acute disease activity in multiple sclerosis. Neurotherapeutics, 23(5), e01060. https://doi.org/10.1016/j.neurot.2026.e01060
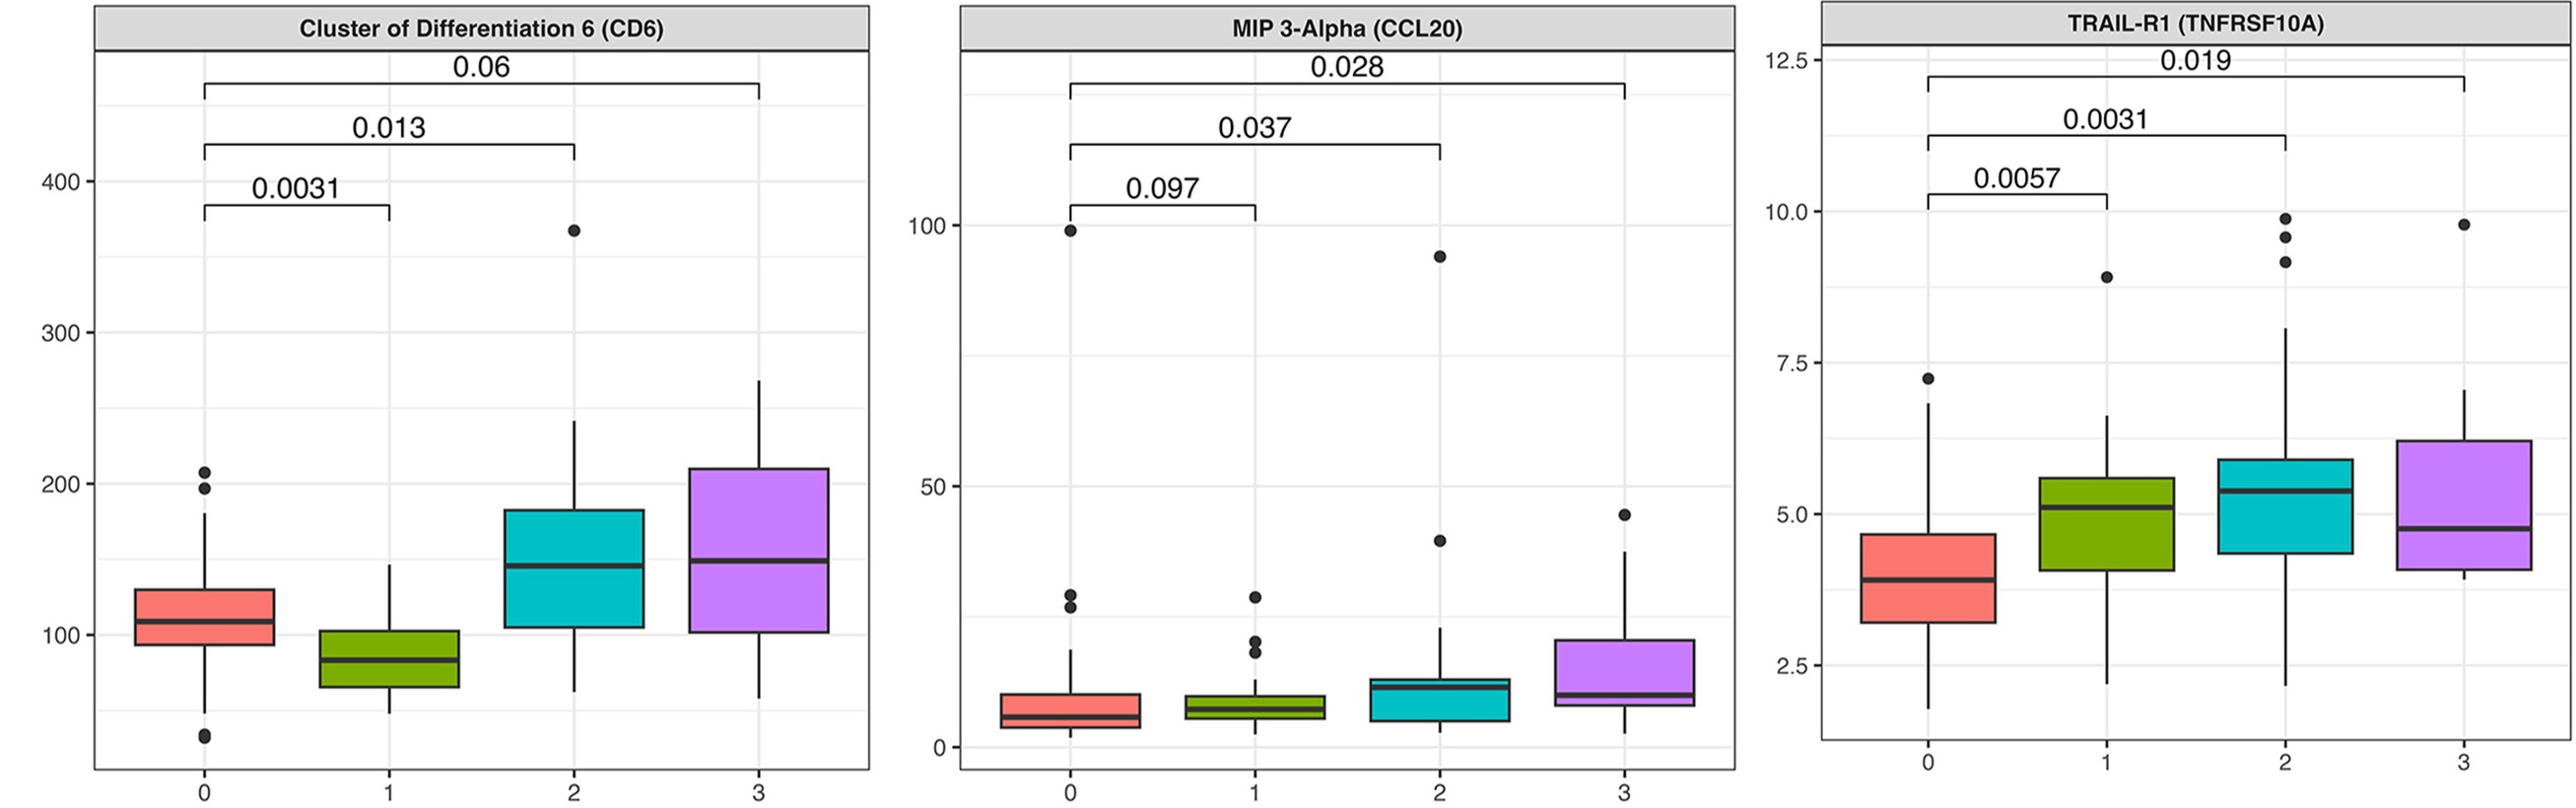
Three of the eighteen proteins, plotted against how many cardiometabolic diagnoses an untreated patient carries. Two of the three rise only at two or three diagnoses. (Okuda, et. al. (2026), Neurotherapeutics 23(5), e01060, three panels of Figure 2, CC BY 4.0)