

Why MS Progression Has Its Own Gene List
Multiple sclerosis (MS) genetics has an uneven record. Susceptibility is close to solved: hundreds of loci, nearly all immune, with the human leukocyte antigen region on top. Progression is close to untouched, and it is the half that decides whether someone keeps walking. The two have usually been treated as one subject on the assumption that the genes driving onset also drive what follows. Three recent studies make that assumption testable, because they run the same machinery on different questions. One maps susceptibility across 731 immune traits. One runs a separate genome-wide study of progression and arrives at a gene list with almost nothing in common. The third explains why the second needed brain tissue at single-nucleus resolution to get there.
Susceptibility, Counted 731 Ways
Wang and colleagues took the immune side as far as the current instruments allow. Rather than test a handful of cell populations, they ran Mendelian randomisation on 731 immune cell traits against MS risk, which turns a question usually asked one cell type at a time into a screen. B cells and dendritic cells came out with causal links to susceptibility, and the markers carrying the signal were CD45 on B cells and CD11c on myeloid dendritic cells. Pairing MAGMA with the PLACO pleiotropy method gave 61 genes shared between the immune traits and MS, concentrated in B-cell antigen presentation and the HLA pathways. The HLA result is worth a second look, because the obvious objection is that everything in MS genetics eventually reduces to HLA. The causal link between CD45 on B cells and MS held after HLA-related variants were removed.
A Different Study, A Different List
Jiang and colleagues started from the gap that makes MS therapy frustrating: more than twenty approved drugs cut relapses, and almost none slow progression. They took a large genome-wide association study of MS progression rather than susceptibility and combined it with protein quantitative trait data from both blood and brain. Proteome-wide association studies nominated candidates, summary-data Mendelian randomisation and colocalisation tested them, and pathway enrichment, drug-target mapping and interaction networks sorted what survived. Forty-eight proteins came through as genetically prioritised, fourteen of those carried therapeutic potential, and thirteen drugs licensed for other conditions matched one of the targets. Pooling those streams and keeping only proteins supported by all of them left six. The filtering matters more here than in a susceptibility study, because progression outcomes are measured on disability scales rather than on a diagnosis, the sample sizes are smaller, and a protein that clears every stage of that funnel has survived a harder test than a single association would impose.
Six Proteins, None of Them Immune
The six are RRM2B, CBR1, ETFA, DNM3, CAB39L and NMRAL1. Three already have drugs pointed at them, with RRM2B a target of cladribine, which is licensed in MS. DNM3 sits at a locus the association studies had already flagged. None is a B-cell gene, an antigen presentation gene or an HLA gene. The validation is where the single-cell layer earns its keep: the authors tested the prioritised proteins against single-cell data across fourteen blood cell types, and against single-nucleus sequencing of white matter from four progressive MS patients and five controls, across eight brain cell types, with differential expression judged by Wilcoxon tests at a 5 percent false discovery rate. A protein nominated by blood genetics that then shows differential expression in a specific brain cell type is a much narrower claim than one nominated by blood genetics alone.
A Regulatory Map at Cell-Type Resolution
Zeng and colleagues built the resource that makes the previous step possible for everyone else. They assembled a single-nucleus, multi-ancestry atlas of genetic regulation in the human prefrontal cortex: 5.6 million nuclei from 1,384 donors across three brain banks, with non-European ancestry running from a quarter to three quarters of donors depending on the bank. Working at eight major cell classes and 27 subclasses, they found genetic regulation for 14,258 genes, of which 981 show cell type-specific regulatory effects at the class level and 857 at the subclass level. The number of genes with detectable regulation tracks how common the cell type is, which is a sampling limit rather than a biological one, and the effect sizes of non-neuronal cell types agree with bulk tissue far less well than neurons do.
Where MS Lands on That Map
Overlaying disease variants on that map changes several answers. Colocalisation turned up cell type-specific genes for Alzheimer's disease and schizophrenia that bulk tissue analysis had missed entirely, which is the practical case for the whole exercise. For MS the result is less expected. Heritability enrichment put Alzheimer's and Parkinson's disease in microglia, the cell type everyone would have guessed, while at the class level Parkinson's disease, MS and amyotrophic lateral sclerosis showed enrichment in neurons. An immune disease showing brain regulatory enrichment in neurons rather than in microglia is the kind of result that only appears once the regulatory map has cell types in it, and it sits oddly beside a susceptibility literature built almost entirely on lymphocytes. It also fits the direction the progression work points in, since a protein list without an immune gene on it has to act somewhere, and the brain cell types are where it can.
What Follows From Two Lists
Keeping susceptibility and progression apart has consequences that reach past bookkeeping. A drug target nominated by susceptibility genetics is a target for preventing MS in people who do not have it, which is not a trial anyone is running. Progression genetics names targets for people already diagnosed, which is the trial that exists. The three studies also divide the labour cleanly: the immune screen says which cells start the disease, the progression analysis says which proteins track its course, and the regulatory atlas says which brain cell type a variant works through. What none of them does is connect a susceptibility allele to a progression protein in the same person, and until a cohort carries genotype, progression and brain tissue together, the two gene lists stay two gene lists.
Disclaimer: This blog post is based on the cited studies and is intended for informational purposes only. It is not intended to provide medical advice. Please consult with a healthcare professional for any health concerns.
References:
Wang, X., Wang, Y., & Liu, X. (2026). Elucidating the causal relationships between B cells, dendritic cells, and multiple sclerosis pathogenesis. Brain and Behavior, 16(3), e71292. https://doi.org/10.1002/brb3.71292
Jiang, Y., Xiao, J., Kockum, I., et al., Alfredsson, L., & Jiang, X. (2026). Multi-omics integration provides biological insight and prioritizes potential drug targets in multiple sclerosis progression. Journal of Neuroinflammation, 23(1), 198. https://doi.org/10.1186/s12974-026-03895-z
Zeng, B., Yang, H., et al., Hoffman, G. E., & Roussos, P. (2026). Single-nucleus atlas of cell-type specific genetic regulation in the human brain. Nature Genetics, 58(10), 2525-2534. https://doi.org/10.1038/s41588-026-02733-5
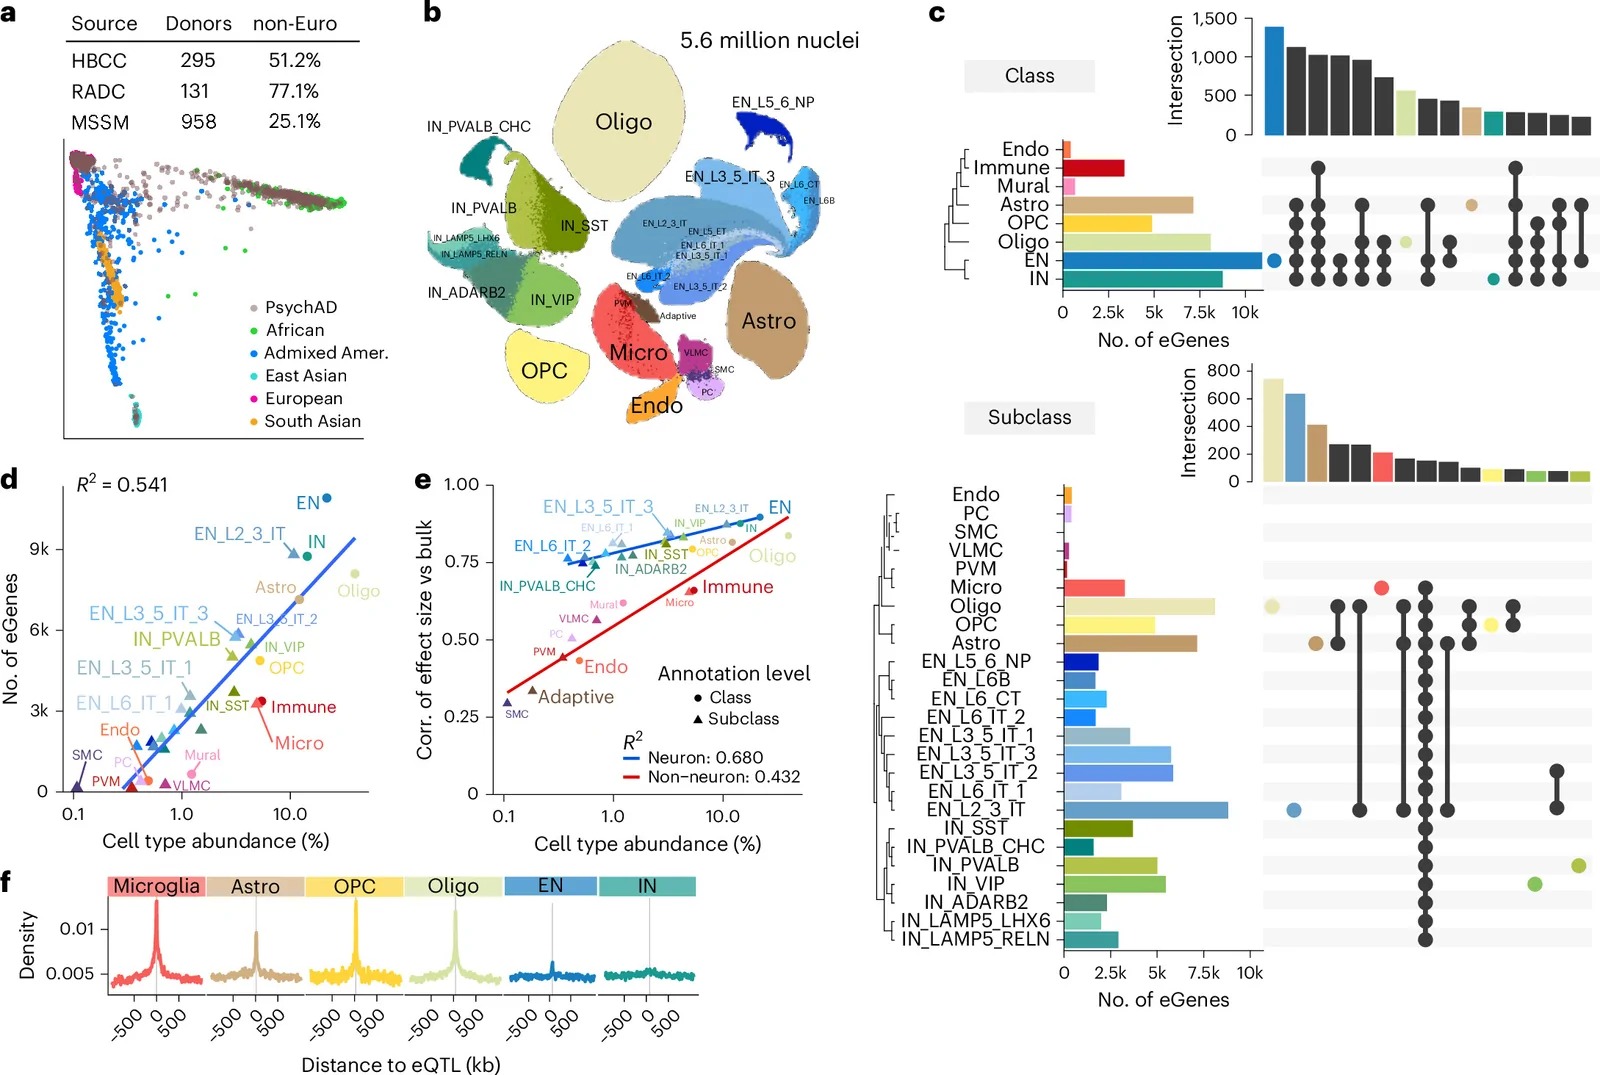
The map MS progression genetics now has to work on: 5.6 million nuclei from 1,384 donors of mixed ancestry, sorted into eight cell classes and 27 subclasses, with the number of genes under detectable genetic regulation given for each. (Zeng, et. al. (2026), Nature Genetics 58(10), 2525-2534, Figure 1, CC BY 4.0)