

MS Genetic Risk, Serum Lipids, and Brain Metabolites

Three recent studies measure something in multiple sclerosis (MS) at three very different costs. The first runs a genotype array on 1,252 patients, a measurement fixed at conception and taken once. The second runs mass spectrometry on serum from two independent sample sets. The third books 7 T spectroscopy time for 20 patients, up to four scans each, across three years. The number of people falls by roughly two orders of magnitude from the first to the third, and what each design can claim moves the other way. Read together they show what the money buys: many people and small effects at one end, few people and a within-person trajectory at the other.
A Genotype Array and a Food Phenotype
Briggs and colleagues used survey and genotype data from the Accelerated Cure Project, which recruited through ten US MS centres between 2006 and 2014: 1,542 people with MS and 700 unaffected controls. The epidemiology came first. Seasonal allergies were the most reported condition in both groups, 36.8% among patients against 41.9% among controls, giving adjusted odds of 0.79 (0.65 to 0.96), and 0.75 when restricted to allergies starting before age 18. Asthma ran lower in patients as well, 11.5% against 13.9%, without reaching significance. Eight less common food and environmental allergies, each below 4% prevalence in both groups, showed no difference at all. Patients who presented with primary progressive disease reported fewer seasonal allergies than those who presented with relapsing disease, 23.9% against 37.8%, but that comparison did not survive correction for multiple testing.
What the Risk Score Explained
The genetic analysis was restricted to 1,252 unrelated non-Hispanic White patients and carried two terms: the number of HLA-DRB1*15:01 alleles and an unweighted score over 198 of the 200 known non-MHC risk variants. Two associations survived correction. Each copy of HLA-DRB1*15:01 came with about 3.5 times the odds of reported gluten allergy or intolerance (p = 0.000025), in a model that also adjusted for self-reported coeliac disease. Each additional risk allele in the non-MHC score came with 0.98 times the odds of childhood-onset seasonal allergies (0.97 to 0.99, p = 0.0015). Two more reached nominal significance and no further: the non-MHC score against gluten intolerance at 1.07 per allele, and HLA-DRB1*15:01 against nut allergy at 1.39 per copy. Those are the findings from 1,252 genotyped patients across eleven phenotypes: one large effect at a single locus, one effect of two percent per allele, and two that correction removed.
Twenty-Five Lipids That Repeated
Shi and colleagues measured serum lipids by liquid chromatography with tandem mass spectrometry in two separate sets: a discovery set of 47 relapsing-remitting patients, 42 people with other neurological disorders and 30 healthy controls, and a validation set of 81 relapsing-remitting, 18 progressive and 33 controls. Comparing relapsing-remitting patients with healthy controls in both sets, 25 lipids were higher in both: eight lysophosphatidylcholines, five lysophosphatidylethanolamines, five diacylglycerols, three sphingomyelins, two acylcarnitines, one ceramide and one hexosylceramide. None was reproducibly lower. Five of them entered a random forest model that reached an area under the curve of 0.83 in discovery and 0.84 in validation, at 83% and 89% sensitivity but 77% and 61% specificity.
The Enzyme That Was Not Raised
Two further results shape what that panel means. The same 25 lipids were also higher in the other neurological disorders group, so the model separates relapsing-remitting patients from healthy people rather than from other neuroinflammatory disease, and the sphingomyelin carrying the strongest signal reached its highest values in neuromyelitis optica and acute disseminated encephalomyelitis samples. Separately, phospholipase A2 is the enzyme normally invoked to explain raised lysophospholipids, and here it was assayed directly instead of inferred from a ratio. Its activity was significantly lower in patients than in controls in the discovery set, and it did not correlate with lysophospholipid levels in either set. One lipid did move with disease activity: pooling both sets, the same sphingomyelin sat higher in samples drawn during a relapse than in remission, at odds of 1.2 per standard deviation (1.1 to 1.3, p = 3.1 × 10⁻³). Correlations with disability score appeared in the validation set and not in the discovery set, and nothing survived correction against the MRI measures. In the 60 patients with paired spinal fluid, lysophospholipids ran in opposite directions in the two compartments while sphingolipids and triglycerides ran together.
Two Ratios in Normal-Appearing White Matter
Zöchner and colleagues moved the measurement into the brain. Twenty relapsing-remitting patients and twenty controls were scanned with 7 T spectroscopic imaging, the patients annually, with 85% giving at least three time points. Median age at baseline was 34, median disability score 1.25 and median disease duration 8.7 years. In normal-appearing white matter at baseline, the ratio of myo-inositol to total N-acetylaspartate was higher in patients than controls (β = 0.058, p = 0.047) and the ratio of N-acetylaspartate to creatine was lower (β = −0.106, p = 0.029), while myo-inositol to creatine did not differ (p = 0.364). Reading the three together puts the shift on the N-acetylaspartate side, the neuroaxonal term, rather than the glial one. The same baseline ratio ran against cerebral white matter volume (β = −0.001, p = 0.015) and with T2 lesion volume (p = 0.044), and grey matter volume was lower in patients than controls by a wide margin (p < 0.001).
Three Years in Twenty People
At baseline 214 lesions were segmented, 36 of them paramagnetic rim lesions, two per patient on average, splitting the group into ten with rim lesions and ten without. In the rim-lesion subgroup the N-acetylaspartate to creatine ratio was further reduced against controls (β = −0.138, p = 0.022). Over three years the myo-inositol to N-acetylaspartate ratio rose in patients (β = 0.014, p = 0.022), and the rise tracked rim lesion count through a time interaction (β = 0.016, p = 0.045) while showing no relation to T2 lesion volume. Meanwhile white matter, grey matter and intracranial volumes did not change measurably, and only three patients developed a new T2 lesion. The cohort also thinned from 20 at baseline to 9 at the last follow-up. So the cheapest measurement had the most people and the smallest effects, the dearest had twenty people and the only within-person trajectory, and the one in between repeated across cohorts without separating MS from the other diseases it was set against.
Disclaimer: This blog post is based on the cited studies and is intended for informational purposes only. It is not intended to provide medical advice. Please consult with a healthcare professional for any health concerns.
References:
Briggs, F., Nyati, A., Zweig, S., & Leung, L. J. (2026). Allergic phenotypes and asthma in multiple sclerosis: epidemiologic and genetic relationships. Multiple Sclerosis Journal, 32(5), 516-524. https://doi.org/10.1177/13524585251398382
Shi, L., Ghezzi, L., et al., Piccio, L., & Don, A. S. (2025). The serum lipid profile of relapsing multiple sclerosis differs reproducibly from healthy controls. Journal of Neurochemistry, 169(11), e70285. https://doi.org/10.1111/jnc.70285
Zöchner, A., Bogner, W., et al., Rommer, P. S., & Niess, E. (2026). Metabolic changes in normal-appearing white matter associate with MRI measures of disease burden in relapsing-remitting multiple sclerosis over three years. Scientific Reports, 16(1), 14808. https://doi.org/10.1038/s41598-026-45342-2
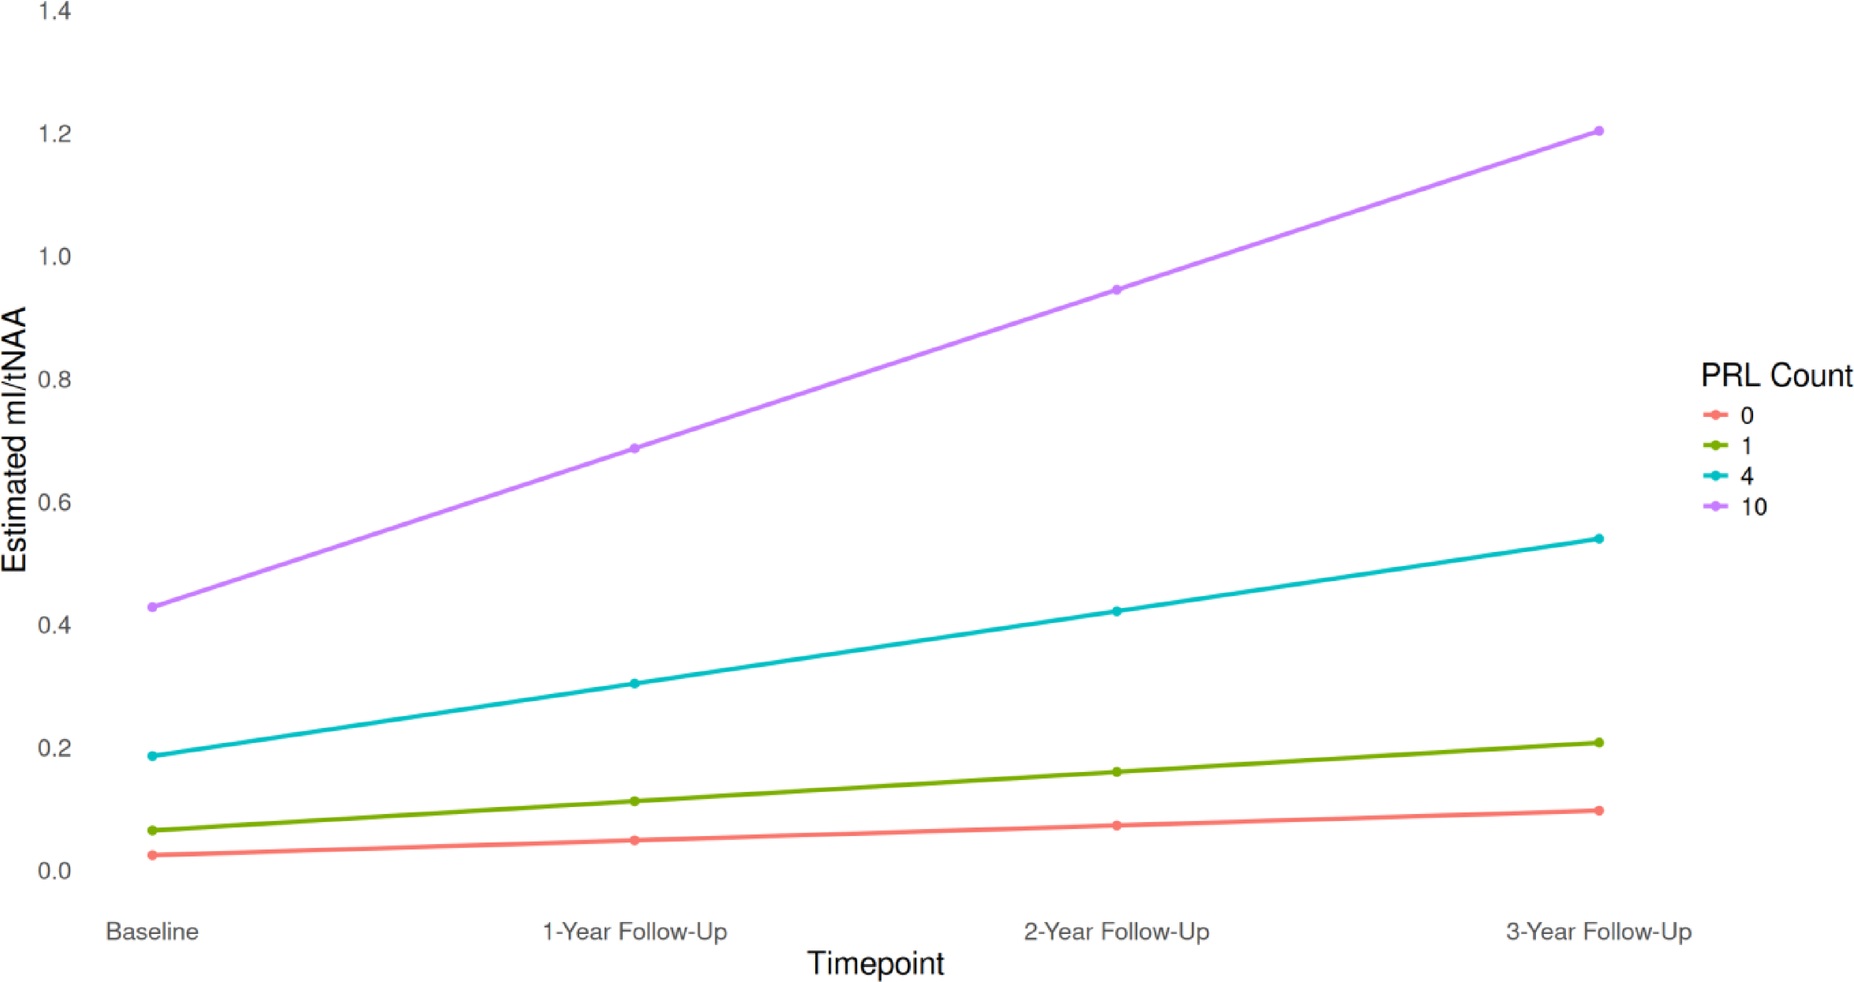
The same ratio, four scans apart, grouped by how many paramagnetic rim lesions a patient carries. The lines separate by rim count and keep separating. (Zöchner, et. al. (2026), Scientific Reports 16(1), 14808, Figure 3, CC BY 4.0)