

The Donor Behind Three MS Measurements
A measurement in multiple sclerosis (MS) is reported as a property of the disease. It is also a property of the person or the tissue it was taken from, and that second attachment is the one most easily left out of the account. Three studies published this year keep the assay fixed and move the material instead: the half of a cohort whose enzyme levels were high enough to use, the donor whose macrophages went into the dish, the brain the myelin came from, and the individual plotted against the group mean. In each case the shift did more to the answer than the method did, and each team records it in the section listing what the work could not settle.
An Enzyme Measured in Blood, Expressed in the Brain
Ahola and colleagues measured chitotriosidase, an enzyme released by activated macrophages and microglia, in serum from 89 people with MS and 16 matched controls in Turku, all of whom had undergone positron emission tomography with a tracer binding the 18 kDa translocator protein. Concentrations ran higher in progressive than in relapsing-remitting disease, 27.9 against 18.9 ng/ml (p = 0.035), but that gap closed once age entered the model, and the MS group as a whole did not differ from controls (22.1 against 19.8 ng/ml). Across the 85 patients retained for correlation, the enzyme tracked serum glial fibrillary acidic protein (ρ = 0.23, p = 0.042) and neurofilament light chain (ρ = 0.26, p = 0.022), and tracked nothing else on offer: not disability, not disease duration, not lesion volume on either sequence.
The Duplication That Was Never Genotyped
A 24 base pair duplication in exon 10 of CHIT1 lowers enzyme activity and removes it in homozygotes, and roughly 35% of Europeans carry one copy against 6% carrying two. The group had no genomic data, so it split the cohort at its own median concentration of 22.1 ng/ml to leave most carriers in the lower half. The imaging associations sit entirely in the upper half of 41 patients: number of rim-active lesions ρ = 0.33, volume 0.39, percentage 0.31, and tracer binding in the ring of tissue 2 to 6 mm outside the lesion 0.36, with all but one holding after age adjustment. The lower half and the full cohort returned none of it. In postmortem tissue, reanalysed spatial transcriptomics placed CHIT1 expression in active lesions and at the edge of chronic active lesions and near zero in inactive, remyelinated and normal-appearing tissue, confined to one myelin-laden microglial state. The authors note that heterozygote levels overlap the median, so the split removes those carriers only in part.
Lipid Droplets Counted in Twenty-Nine Biopsies
Schmitz-Gielsdorf and colleagues went to the tissue where that enzyme is made. Rodent work had tied the lipid droplets forming inside myelin-eating phagocytes to blocked cholesterol disposal and to failed repair, so the group counted perilipin 2 positive myeloid cells across 29 brain biopsies, 25 of them active demyelinating lesions, and set them against oligodendrocyte numbers by three markers and against a remyelination score. Lesions with and without those droplets differed on none of the four. In culture, macrophages from healthy donors carried droplets in 67.0% of cells at 24 hours against 14.1% untreated, and their transcriptome moved from an interferon-weighted profile at 6 hours to one clustering with anti-inflammatory macrophages at 24 hours, with cholesterol biosynthesis among the pathways coming up. Supernatant from both time points cut oligodendrocyte differentiation as sharply as supernatant from pro-inflammatory macrophages, leaving viability untouched. Neither complement C1q nor interleukin 10 reproduced that effect when added on its own.
Macrophages That Answered Only to MS Myelin
Then the donor changed. Macrophages from treatment-naive relapsing-remitting patients took up myelin on the same schedule and built the same droplets, and released nothing measurable: no tumour necrosis factor alpha, no interleukin 1 beta, no effect on oligodendrocytes, although the same cells answered a standard pro-inflammatory stimulus normally. Macrophages from people with stroke or autoimmune encephalitis behaved the same way. What restored the response was changing the other donor. Myelin isolated from MS brain, given to those silent cells, brought back cytokine release and impaired differentiation again. Mass spectrometry of the two preparations identified 5,342 proteins, 722 of them at least twofold higher in the MS myelin, among them fibrinogens, high mobility group box proteins, chitinase-3-like protein 1 and citrullinated myelin basic protein. The authors state that most experiments used mouse myelin for want of human material, that the comparison of human control with MS myelin reached no statistical significance because of variability, and that donor numbers were small throughout.
Nine Hundred and Eighty-Six Metabolites Against One Score
Yadav and colleagues moved the donor in a third sense, from the group to the person. Their sub-study took the 27 adherent participants of a 16 week randomised trial with paired samples, 16 on a low-fat diet and 11 on a waitlist. The diet arm cut calories from fat by 15.2 percentage points against 0.3 in controls, and relative to controls lost 2.2 kg of fat mass and 19.0 mg/dL of low-density lipoprotein cholesterol. Fatigue on the Modified Fatigue Impact Scale fell 12.9 points on the diet and 8.5 on the waitlist, a difference between arms of 4.3 points with an interval from −13.6 to 5.0 that includes zero. Against those scores the group set 986 serum metabolites. The strongest correlation with change in fatigue was octadecenedioylcarnitine (ρ = 0.612), then cis-4-decenoate (0.563) and hexanoylcarnitine (0.524), with phenol sulfate (0.501) and phenylpyruvate (0.496) heading the amino acid side.
Acylcarnitines Moving in Two Directions
The acylcarnitines are where the group and the person separate. Over the trial they fell by 6.5% to 12.5% in the diet arm and rose by 22% to 39% in controls, which fits a change in mitochondrial fatty acid oxidation, though the direction alone cannot say whether that oxidation became more efficient or simply ran lower, since flux was not measured. Inside the diet arm, fibre intake correlated inversely with several of the same metabolites (r = −0.61 to −0.67) and fat intake positively with sphingomyelin (0.58 to 0.60), while among controls no dietary measure correlated with any metabolite at all. Individual participants moved against their own group often enough for the authors to say so: 1-myristoylglycerol rose on average while correlating negatively with fatigue change. They list 11 controls, two sampling points, self-reported intake, unadjusted models and pathway assignments from a single database, and call the analysis hypothesis-generating. Across the three studies the assay stayed where it was and the donor moved, and the donor is where the difference sat.
Disclaimer: This blog post is based on the cited studies and is intended for informational purposes only. It is not intended to provide medical advice. Please consult with a healthcare professional for any health concerns.
References:
Ahola, V., Saraste, M., Pedrini, E., et al., Absinta, M., & Airas, L. (2026). Serum chitotriosidase links to activated glia at chronic active lesion rims in multiple sclerosis brain. Annals of Neurology, advance online publication. https://doi.org/10.1002/ana.78386
Schmitz-Gielsdorf, L. E., Heß, K., Thomas, C., et al., Klotz, L. H., & Kuhlmann, T. (2026). Impact of myelin phagocytosis on human myeloid cells and its effect on human oligodendrocytes. Brain Communications, 8(6), fcag411. https://doi.org/10.1093/braincomms/fcag411
Yadav, V., Kelley, L., Young, E., et al., Srikanth, P., & Yildiz, S. (2026). Low-fat diet reduces fatigue and alters serum metabolomic pathways in people with multiple sclerosis: a sub-study of a randomized controlled trial. Multiple Sclerosis and Related Disorders, 116, 108019. https://doi.org/10.1016/j.msard.2026.108019
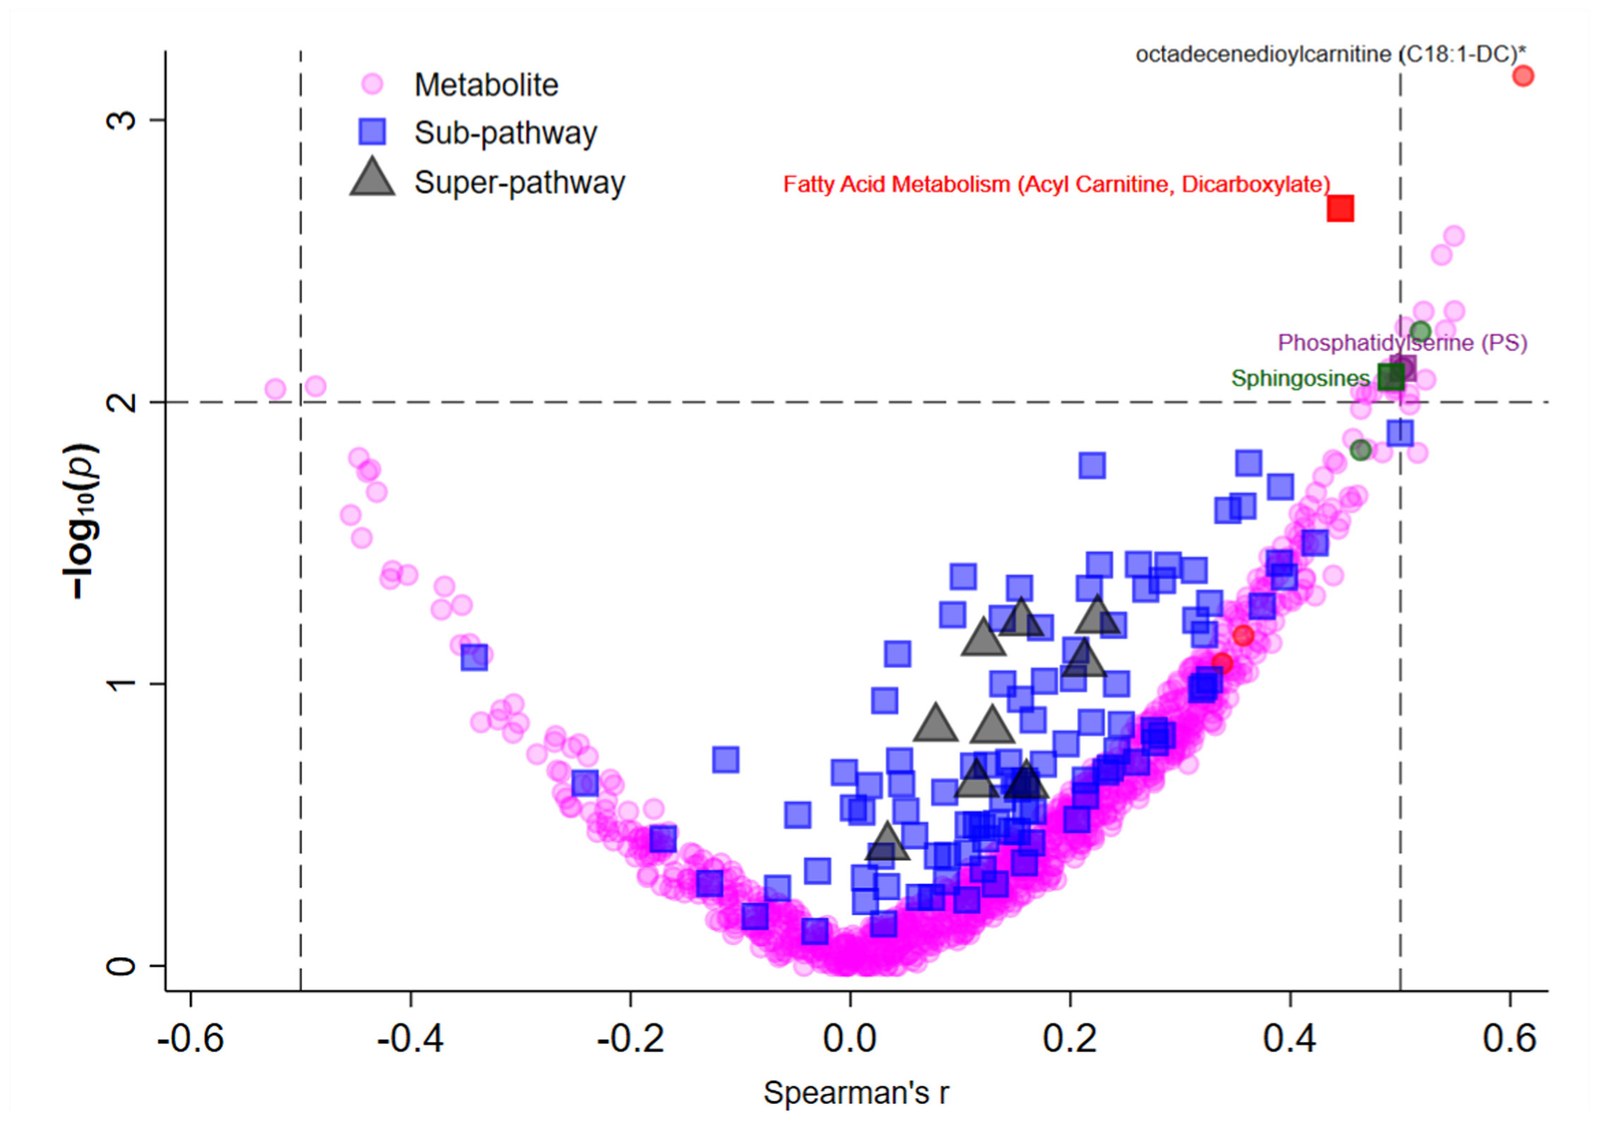
Every measured metabolite plotted against the change in fatigue score, with individual compounds as circles, sub-pathways as squares and super-pathways as triangles. The fatty acid metabolism sub-pathway and its highest ranking compound sit alone in the upper right corner. (Yadav, et. al. (2026), Multiple Sclerosis and Related Disorders 116, 108019, Figure 2, CC BY 4.0)