

MS Measured by Ancestry, by Genotype, and by Lesion
Before a study of multiple sclerosis (MS) measures anything, it has to decide how finely to cut the sample. The cut can be a population label, a pair of genotypes within one gene, or a single lesion inside one brain, and the choice is made while the data are still being collected. Three studies published this year cut at those three levels, and all three report the same shape of result: the comparison between the large groups returns nothing, and whatever signal exists appears only after the groups are made smaller. Each team is also explicit about what the finer cut costs, which is more tests to correct for, fewer people in each cell, and intervals wide enough to span orders of magnitude.
Ancestry Instead of a Census Label
Jacobs and colleagues recruited people with MS across the United Kingdom between 2021 and 2025, through hospital sites, primary care, the UK MS Register and an online portal, and genotyped them from saliva. Genetic ancestry was inferred with a random forest classifier trained on a reference dataset, checked against a second genome-wide method and against haplotype-level local ancestry. The cohort of 816 comprised 316 people of European ancestry (38.7%), 260 of South Asian ancestry (31.9%), 163 of African ancestry (20.0%) and 77 from other backgrounds, 72.3% women, diagnosed at a median age of 32. The labels matched the continuous measure, with a median of 91.9% global African ancestry in the inferred African group, and they also showed their own limits, since 47 of those 163 people carried more than 10% European ancestry. Disability scores were available for 781 participants, 637 of them taken directly and 144 filled in from other reported measures, and in the 44 with a clinic score recorded within six months the two agreed closely (r = 0.75, p = 3.7 × 10⁻⁹).
Eighteen Tests, or Twelve
The group set its threshold before looking: three ancestry terms against six outcomes gives 18 tests and a Bonferroni threshold of 0.0028, while a principal component analysis of the six outcomes showed that four components carried 97.9% of the variance, giving a more lenient threshold of 0.004. South Asian ancestry came with diagnosis 5.1 years earlier than European ancestry (95% CI −6.9 to −3.4, p = 1.3 × 10⁻⁸), and Middle Eastern ancestry with 6.4 years earlier, both holding within single recruitment routes. Progressive-onset disease was reported at a similar rate in each group, at 9.2%, 7.4% and 9.4%. Severity gave nothing. The age-adjusted severity score was marginally higher in the South Asian group before adjustment and flat after it, and the same absence held for the raw disability score, the duration-adjusted score, the patient-reported impact scale and the quality of life scale, in every sensitivity analysis the authors ran. A genome-wide scan within each ancestry found no significant variant, and the known severity locus at DYSF-ZNF638 was directionally concordant in two of the three groups with power between 6.6% and 12.7%.
Three Variants in One Receptor Gene
Siokas and colleagues took the cut down to genotype. They typed three much-studied variants in VDR, the gene for the receptor through which vitamin D acts, in 200 people with MS and 265 neurologically healthy controls from a Southeastern European population, with a 100% genotype call rate and control frequencies in Hardy-Weinberg equilibrium. Compared one at a time, none of the three separated cases from controls, in genotype counts or allele counts, under any inheritance model. Haplotype analysis added nothing, with the one haplotype that moved reaching an odds ratio of 2.367 and an interval from 0.950 to 5.899. The design carries two mismatches the authors name: the controls averaged 57.7 years against 33.8 at symptom onset in the cases, and 72% of cases against 49.8% of controls were women. Serum vitamin D itself was never measured, and HLA-DRB1*15:01 status was not available.
An Interaction Term and Its Interval
Three nested logistic models followed. The first held only main effects and found none. The second added variant-by-variant interaction terms, and one of them, the FokI CT genotype combined with the TaqI AG genotype, gave an odds ratio of 15.962 at p = 0.034, which survived Benjamini-Hochberg correction at an adjusted p of 0.041. The third model added sex, which was the strongest term in the study at an odds ratio of 2.587. Model fit improved as terms were added, with the Nagelkerke R² rising from 0.018 to 0.118 and classification accuracy from 57.5% to 62.3%, and the authors read the perfect goodness-of-fit statistic in the second model as a sign of possible overfitting. A post hoc calculation put the power of the 465 participants at 0.81 for an odds ratio of 1.5, so small effects would have been missed. Cutting the patients instead of the cohort, the BsmI AA genotype was more frequent among those with motor symptoms (adjusted odds ratio 0.389 for the comparison group, p = 0.013) and the BsmI GG genotype more frequent among those without cervical cord lesions (0.393, p = 0.019). Sensory symptoms gave nothing.
Glutamate Mapped One Lesion at a Time
Jacobs, Spangler and colleagues cut at the level of tissue. Using 7 tesla imaging, they measured a glutamate-weighted signal alongside T1 mapping and susceptibility mapping in 20 people with MS and 11 controls, averaging 4.9 paramagnetic rim lesions and 19.5 other lesions per patient. Seventeen of the patients had relapsing-remitting disease, mean duration was 7.4 years, and all but four were on treatment. Between groups the measurement was flat, with no difference in normal-appearing white or gray matter between patients and controls. Within patients it separated lesion types. The glutamate-weighted signal was 10.7% higher in rim lesions than in lesions without a rim and 13.0% higher than in normal-appearing white matter, while lesions without a rim were indistinguishable from that tissue. T1 relaxation was long in both lesion types and did not tell them apart. In a regression, lesion type predicted the glutamate signal (β = −1.24, p = 0.03) while lesion volume did not (β = 0.01, p = 0.82).
What the Lesion Measurement Tracked
In the 15 patients who completed timed tests, the glutamate signal fell as performance worsened, in rim lesions (R² = 0.50 for the timed walk and 0.54 for the nine-hole peg test, both p < 0.01) and also in normal-appearing white and gray matter. The direction is worth holding alongside the lesion result, since the signal sits high inside rim lesions and low in the tissue of people who walk more slowly. Across every tissue class, the glutamate measure and the susceptibility measure were uncorrelated, which the authors take as evidence that iron at the lesion rim is not producing the glutamate contrast. They list what 20 participants at one time point cannot settle: no reproducibility statistics for the lesion segmentation, no longitudinal tracking of how a rim lesion evolves, a cohort almost entirely on therapy, and an open question about whether the method survives the move to the 3 tesla scanners in ordinary use. Across the three studies the larger comparison was empty each time, and the finding sat one cut further down.
Disclaimer: This blog post is based on the cited studies and is intended for informational purposes only. It is not intended to provide medical advice. Please consult with a healthcare professional for any health concerns.
References:
Jacobs, B. M., Tregaskis-Daniels, E., et al., Noyce, A. J., & Dobson, R. (2026). Association between genetic ancestry and multiple sclerosis severity. Annals of Neurology, advance online publication. https://doi.org/10.1002/ana.78350
Siokas, V., Raptis, A. E. P., et al., Dardiotis, E., & Papasavva, M. (2026). Vitamin D receptor gene variants and their association with clinical phenotypes of multiple sclerosis. Multiple Sclerosis and Related Disorders, 115, 107962. https://doi.org/10.1016/j.msard.2026.107962
Jacobs, P. S., Spangler, B., et al., Schindler, M. K., & Reddy, R. (2026). Altered glutamate homeostasis in paramagnetic rim lesions of patients with multiple sclerosis. Imaging Neuroscience, 4, IMAG.a.1406. https://doi.org/10.1162/IMAG.a.1406
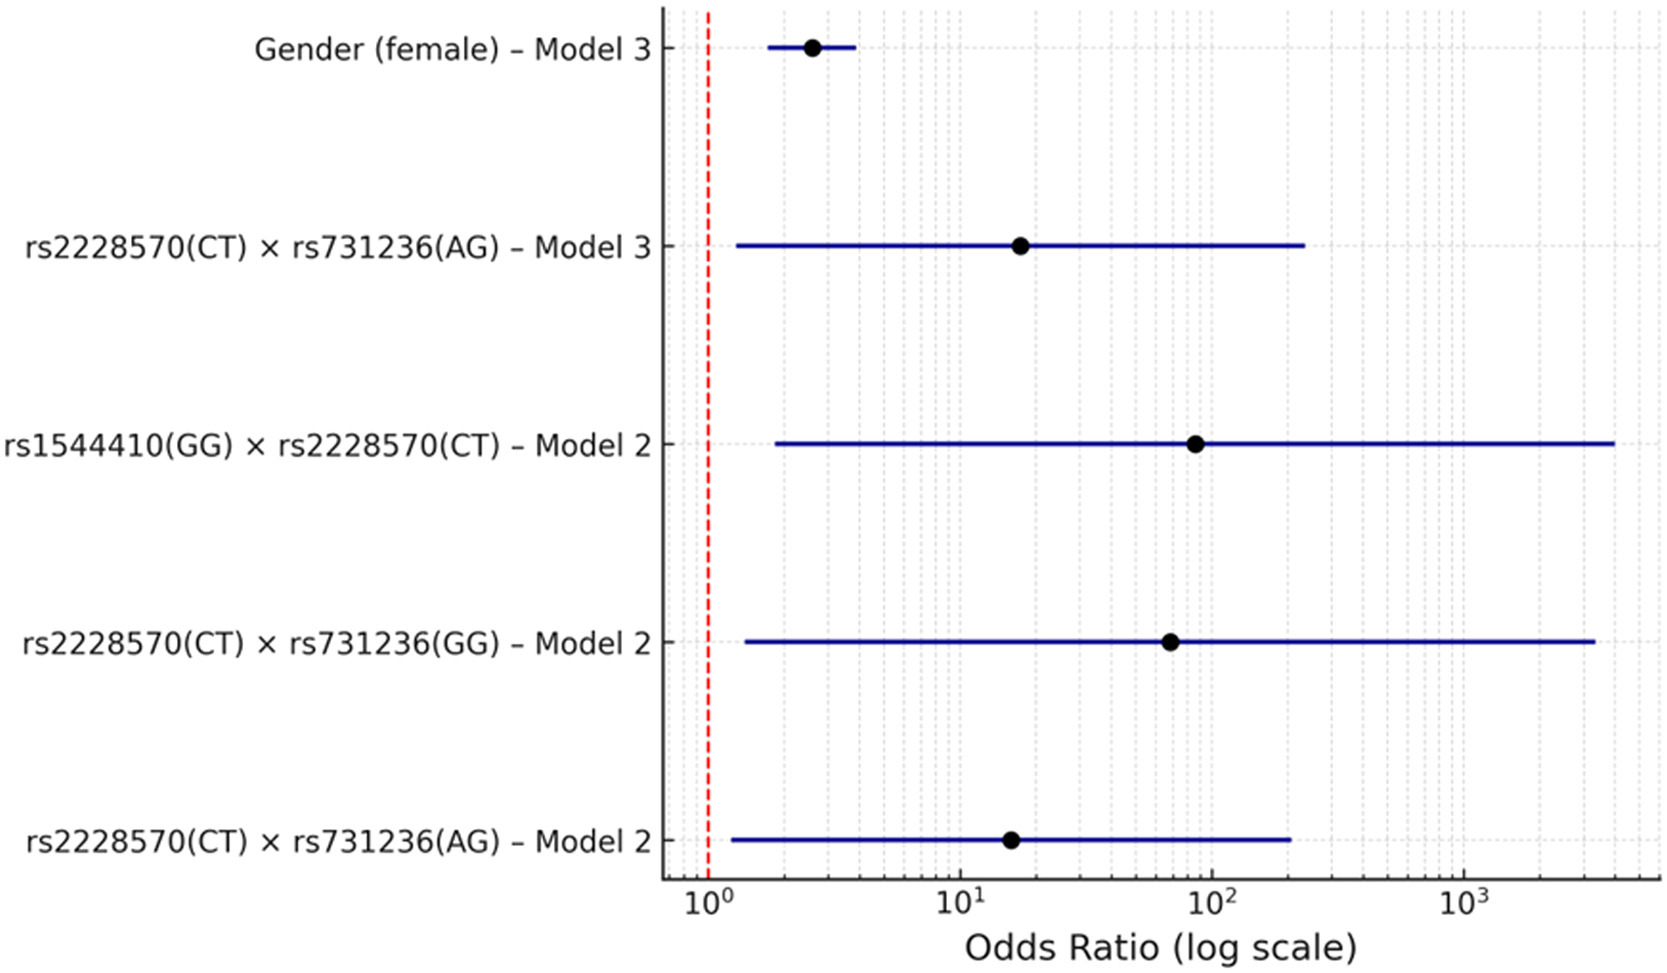
The terms that survived correction in the two logistic models, plotted on a log scale. The sex term sits close to the null line with a narrow interval, while the three genotype interaction terms carry intervals that run to three orders of magnitude. (Siokas, et. al. (2026), Multiple Sclerosis and Related Disorders 115, 107962, Figure 1, CC BY 4.0)