

An MS Variant, a Gut Fatty Acid, and Neuronal Fuel
A familiar chain runs through work on multiple sclerosis (MS): a genotype shifts a molecule, the molecule shifts the immune system or the brain, and the disease behaves differently. Three studies published within weeks of each other each sit on a different link of that chain, and each reports that the join to the next link is not there. In one, a metabolite tracks relapses while nothing in the diet tracks the metabolite. In another, a variant tracks a cell count but not the disability score, while the cell count does track it. In the third, neurons carrying a patient's genome burn fuel differently, but only after they have finished differentiating. The absences are worth reading because in each case the group measured the missing link rather than assuming it.
Ten Fatty Acids, One That Repeated
Schoeps and colleagues measured ten straight and branched-chain fatty acids of two to ten carbons by targeted mass spectrometry in young people sampled soon after onset: 127 plasma samples from the University of California San Francisco, median age 15.6 years and median disease duration 0.6 years, with 79.5% not yet on therapy, then 150 more from the other centres of the US Network of Pediatric MS Centers. Only propionate moved with all three outcomes. Per standard deviation, plasma propionate came with a 27% lower annualised relapse rate (adjusted incidence rate ratio 0.73, 0.58 to 0.91, q = 0.042), a 25% lower rate of new enhancing lesions (0.75, 0.62 to 0.90, q = 0.027) and a nominal 12% lower rate of new T2 lesions (0.88, q = 0.364). Pooling both cohorts gave 0.80, 0.79 and 0.89, all three surviving. Octanoate ran the other way, 18% more enhancing lesions per standard deviation (1.18, q = 0.024).
The Fiber That Did Not Explain It
Propionate is made in the colon by bacterial fermentation of dietary fiber, so the obvious upstream term is fiber intake. Five of the ten plasma fatty acids were correlated with it: isobutyrate (r = 0.30), 2-methyl-butyrate (r = 0.36), isovalerate (r = 0.39), valerate (r = 0.33) and caproate (r = 0.28). Propionate was not among them, nor was butyrate. In stool the correlation with fiber ran negative for both (r = −0.51, p = 0.052 for propionate, r = −0.57, p = 0.027 for butyrate), and plasma and stool propionate were not correlated with each other at all. Plasma propionate was also uncorrelated with neurofilament light chain and glial fibrillary acidic protein, which the authors read as evidence it is not standing in for recent neuronal or astrocytic injury. Their conclusion follows the gap: supplementing propionate itself is a more plausible route to test than fiber, with the caveat they raise themselves, that calcium propionate in healthy volunteers has produced insulin resistance.
A Variant That Sets a Cell Count in Spinal Fluid
Natural killer T cells are the lymphocytes that respond to lipid antigen presented on CD1d, and their frequency in spinal fluid is lower in MS. Wirsching and colleagues asked what sets that frequency within the disease, running a genome-wide association study on spinal fluid natural killer T cell frequency in 456 people with MS or clinically isolated syndrome, 83.1% of them sampled within 30 days of diagnosis. The median frequency was 0.7% of lymphocytes against 1.5% in a comparison cohort (p = 4.25 × 10⁻³⁰). One locus reached significance: rs6783734, intronic in ITGB5 on chromosome 3, minor allele frequency 18.2%, worth 0.720 percentage points per allele (p = 3.25 × 10⁻⁸). It replicated in 90 further people for a joint p of 4.57 × 10⁻⁹ and held in the 429 untreated at lumbar puncture. In 368 people with other neurological diagnoses it did nothing (p = 0.14), with an interaction test at p = 2.25 × 10⁻⁶.
From the Variant to the Gene, and Not to the Score
The functional follow-up held together. In single-cell data from the spinal fluid of 96 people, the same allele came with lower ITGB5 expression in CD4-positive T cells (β = −0.66, p = 3.12 × 10⁻³), colocalisation put the two signals on a shared causal variant (p = 8.10 × 10⁻³), and Mendelian randomisation pointed from higher expression to fewer natural killer T cells (β = −0.614, p = 7.18 × 10⁻⁷). Two things it could not do. Fine mapping left a credible set of 32 variants in tight linkage with a top posterior probability of 0.109, so the causal variant is unidentified. And the variant was unrelated to age-related MS severity at either time point (p = 0.644 and p = 0.713), while the cell frequency it governs was related, not at the lumbar puncture (p = 0.231) but in the 340 people scored at least a year later (β = 0.103, p = 9.33 × 10⁻³).
Neurons Grown From Urine Cells
Böse and colleagues went back to the genome a different way. From 200 mL of urine they isolated renal tubule epithelial cells, reprogrammed them to induced pluripotent stem cells, and differentiated those into neural precursor cells and then neurons. Reprogramming erases the epigenetic marks, exposures and drug effects a donor has accumulated and keeps the genome, so a difference that survives it belongs to the genetic background. Stable lines came from three of 21 patient samples: two men aged 32 and one woman aged 35, disability scores of 2.0 to 3.0, each on a different therapy, against two controls. In the mature neurons, basal respiration, ATP production and proton leak were no different between groups, while spare respiratory capacity (p = 0.0002) and non-mitochondrial oxygen consumption (p = 0.0207) were lower in the MS lines. The deficit sat in the reserve, not the resting rate.
Glycolysis Before and After Differentiation
Glycolysis told the stage-dependent half. In the mature MS neurons every glycolytic parameter was lower than in controls: glucose-stimulated glycolysis (p = 0.0001), glycolytic capacity and non-glycolytic acidification (both p < 0.0001) and glycolytic reserve (p = 0.0018). In precursors from the same donors, glycolysis and glycolytic capacity were indistinguishable from controls and only the reserve was reduced (p = 0.0359). Contacts between endoplasmic reticulum and mitochondria followed the same pattern, higher in the MS neurons (p < 0.0001) and no different in the precursors. Mitochondrial shape even reversed between stages, more fused in the neurons and more fragmented in the precursors. The authors are explicit about what three donors and two controls can carry: the data cannot separate an MS-associated phenotype from donor-to-donor variation, the effects were reproducible across experiments rather than across people, and the work stands as proof of concept.
Disclaimer: This blog post is based on the cited studies and is intended for informational purposes only. It is not intended to provide medical advice. Please consult with a healthcare professional for any health concerns.
References:
Schoeps, V. A., Bhargava, P., et al., Borkowski, K., & Waubant, E. (2026). Propionate, a short-chain fatty acid, is associated with disease activity in pediatric-onset multiple sclerosis. Cell Reports Medicine, 103136. https://doi.org/10.1016/j.xcrm.2026.103136
Wirsching, L., Pukaj, A., et al., Hemmer, B., & Gasperi, C. (2026). Genetic variation underlying CSF natural killer T-cell frequency in inflammatory CNS diseases: a genome-wide association study. Neurology: Neuroimmunology & Neuroinflammation, 14, e200676. https://doi.org/10.1212/NXI.0000000000200676
Böse, C., Rehm, A., et al., Bader, V., & Motte, J. (2026). Altered metabolism and endoplasmic reticulum-mitochondria contacts in multiple sclerosis neurons. Frontiers in Neurology, 17, 1915238. https://doi.org/10.3389/fneur.2026.1915238
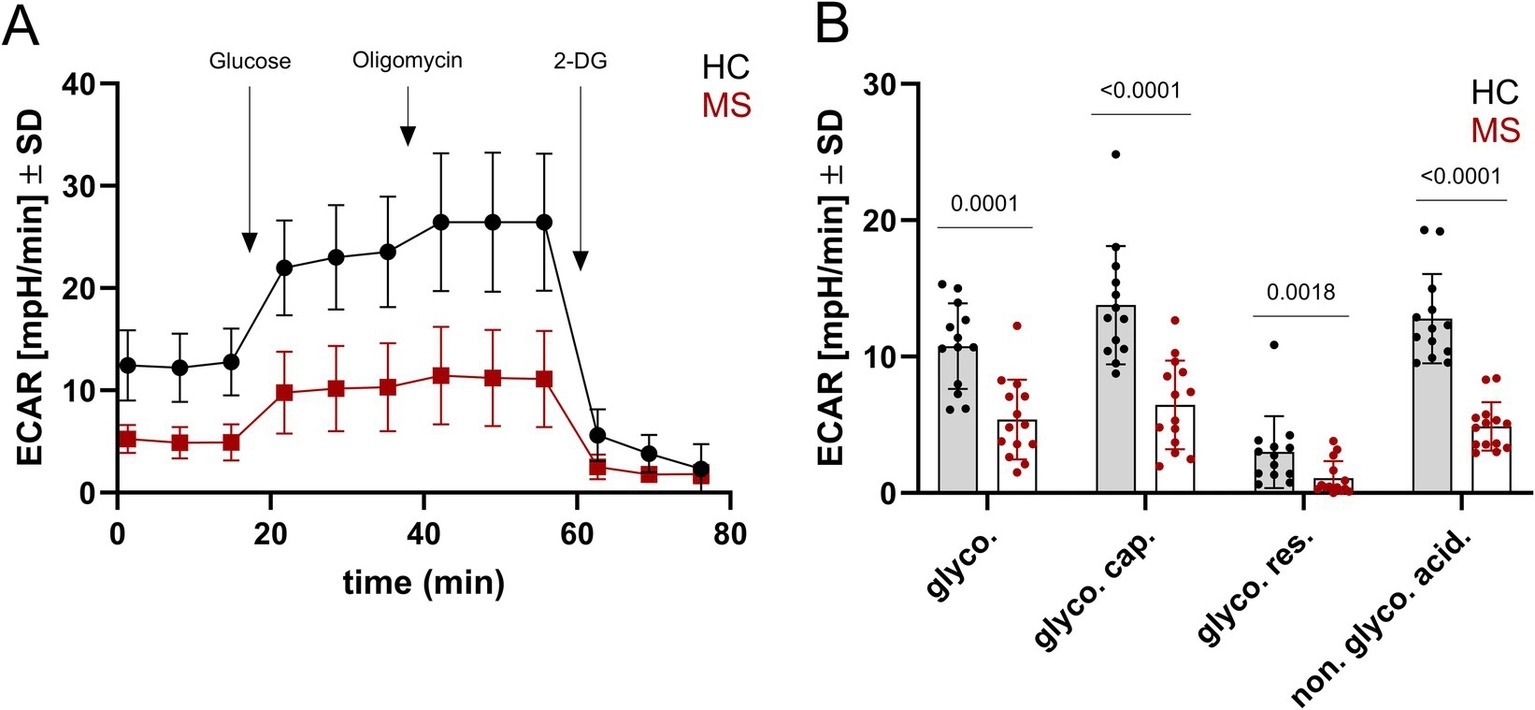
A glycolysis stress test in induced neurons from two MS donors and two controls, with the flux parameters beside the trace. Every glycolytic parameter sits lower in the MS-derived neurons. (Böse, et. al. (2026), Frontiers in Neurology 17, 1915238, Figure 3, CC BY 4.0)