

An MS Genotype, a Spatial Null, and a Moving Reference

Every result in multiple sclerosis (MS) research is a comparison, and the comparison is chosen before the data arrive. An odds ratio needs a reference group. A spatial correlation between two brain maps needs a null distribution, because two smooth maps of the same cortex will correlate by construction. A metabolite concentration measured by spectroscopy needs an internal reference, and that reference is assumed to hold still. Three studies published this year make those choices unusually visible, each in a different corner of the field: a Swedish case-control study of an occupational exposure against genotype, a multicentre imaging study of where the brain thins, and a small spectroscopy study of one brain region before and after a physical task.
Oils, Lubricants, and 2,872 Cases
Hedström and colleagues used the Swedish EIMS study, which recruited incident MS cases from 40 neurology departments between 2005 and 2015 and drew two population-register controls per case, matched in groups by age, sex and residential area. Response rates were 93% among cases and 73% among controls, giving 2,872 cases and 6,122 controls. Participants reported occupational contact with cutting fluids, engine oil, hydraulic oil and concrete form oil before the year of first symptom, with timing and weekly hours. Exposure was reported by 251 cases and 399 controls, 77% of the exposed cases being men, working mainly in metalworking (23%), construction (17%), automotive repair (11%) and machinery maintenance (10%). Adjusted odds of MS were 1.38 (1.16 to 1.65), with 1.02 per year of exposure and 1.02 per additional weekly hour. By product, concrete form oil gave 1.92 (1.20 to 3.07) and hydraulic oil alone did not reach significance.
Two HLA Alleles and an Attributable Proportion
The genetic part is where the choice of reference does the work. Interaction was measured as the attributable proportion, defined as the excess odds in the doubly exposed group beyond the sum of the two separate effects, divided by the doubly exposed odds. Against carriers of HLA-A*02:01 who were unexposed, lubricant exposure and absence of that allele together gave an attributable proportion of 0.32 (0.05 to 0.59). For HLA-DRB1*15:01 the same calculation gave 0.19, with an interval from −0.08 to 0.46 that includes zero. Building the full combination against a reference of non-carriers with the protective allele who neither smoked nor worked with lubricants, the highest-risk cell reached odds of 33.65. Its interval runs from 7.52 to 151, because the cell holds 16 cases and 2 controls, which the authors state plainly. Dropping exposure in the seven years before onset left the main estimate at 1.55 (1.27 to 1.90).
Atrophy Scored Against 224 Controls
Barrantes-Cepas and colleagues assembled structural MRI from three European centres acquired between 2014 and 2023: 1,963 people with MS or clinically isolated syndrome and 224 healthy controls, 2,187 participants in total, with 565 patients contributing more than one scan over a mean follow-up of 3.48 years. Cortical thickness came from 100 regions and volume from 14 subcortical structures. Regional atrophy was expressed as a W-score, the deviation from the control group after adjusting for age, sex, intracranial volume and site, which is what makes a thickness value in one cohort comparable with another. Thalamic volume loss was the largest single effect (Cohen's d = 1.07). The study then tested four competing accounts of why atrophy lands where it does: nodal stress, transneuronal spread, disconnection by white matter lesions, and transcriptomic vulnerability, the idea that regions with similar gene expression share a fate.
Ten Thousand Permuted Maps
Each account became a map, and each map was correlated with the atrophy map against a null built by spatially permuting the maps ten thousand times. Functional cortical hubness correlated with cortical atrophy at r = 0.38 (P = 0.01). Atrophy in a region tracked atrophy in its connected neighbours at r = 0.41 for functional and r = 0.51 for structural connections, and both survived a further permutation test that held physical proximity constant (r = 0.31 and r = 0.44). Lesional disconnection gave r = 0.16 (P = 0.10). Transcriptomic vulnerability, built from the Allen Human Brain Atlas, gave r = −0.13 in the cortex (P = 0.2). At the individual level the structural neighbour effect was the largest (d = 1.76) and reached significance in 50.8% of patients. One nuance runs the other way: in a model of future atrophy over follow-up, which explained 30.3% of the deviance, the transcriptomic term was significant alongside the connectivity terms.
A Reference That Moved
Brownbill and colleagues scanned a single 9 mL voxel in the dorsal anterior cingulate cortex in 22 people with relapsing-remitting MS and 22 age and sex matched controls, before and after two bouts of sustained isometric wrist extension inside the scanner. All patients had a disability score below 3.5 and substantial fatigue by two questionnaires. Lactate was higher in patients both before and after the task (0.97 against 0.75 mmol/kg at rest, F = 7.08, p = 0.011), and glutamate plus glutamine did not differ at all. Total creatine is the quantity spectroscopy studies conventionally treat as a stable internal reference, and here it was not: there was no group difference, but a group by time interaction (F = 4.63, p = 0.037), with creatine falling after exercise in controls (t = 3.09, p = 0.02) and holding flat in patients. Maximal voluntary force did not differ between groups, so the task was not simply harder for one of them.
What the Metabolites Did Not Track
The study set out to connect brain metabolism to fatigue, and on that point it reports a negative. No baseline metabolite concentration correlated with trait or state fatigue in either group, and no post-exercise concentration correlated with post-exercise fatigue. The one correlation that appeared was between the change in lactate and the change in perceived effort, in patients only (r = 0.51, p = 0.04). The authors list what constrains this: a roughly four minute delay between the end of exercise and acquisition, which may have let metabolites partly normalise and could explain why lactate did not rise after exercise in either group; a single region, leaving open whether the thalamus or a wider network behaves the same way; and a cohort with long disease duration but low disability, which may be why glutamate looked normal. Five lactate recordings in patients were dropped for spectral quality. Three studies, three reference points, and in the third the reference itself was the finding.
Disclaimer: This blog post is based on the cited studies and is intended for informational purposes only. It is not intended to provide medical advice. Please consult with a healthcare professional for any health concerns.
References:
Hedström, A. K., Olsson, T., & Alfredsson, L. (2026). Occupational exposure to petroleum-derived lubricants and risk of multiple sclerosis. Neurology, 107, e218718. https://doi.org/10.1212/WNL.0000000000218718
Barrantes-Cepas, M., Tranfa, M., et al., Schoonheim, M. M., & Pontillo, G. (2026). The role of network connectivity and transcriptomic vulnerability in shaping gray matter atrophy in multiple sclerosis. Science Advances, 12(46), eaeg3412. https://doi.org/10.1126/sciadv.aeg3412
Brownbill, G., Dekerle, J., Cercignani, M., Ronen, I., & Stone, J. (2026). Metabolic dysfunction in multiple sclerosis: elevated lactate and impaired post-exercise creatine response in the anterior cingulate cortex. Multiple Sclerosis and Related Disorders, 112, 107339. https://doi.org/10.1016/j.msard.2026.107339
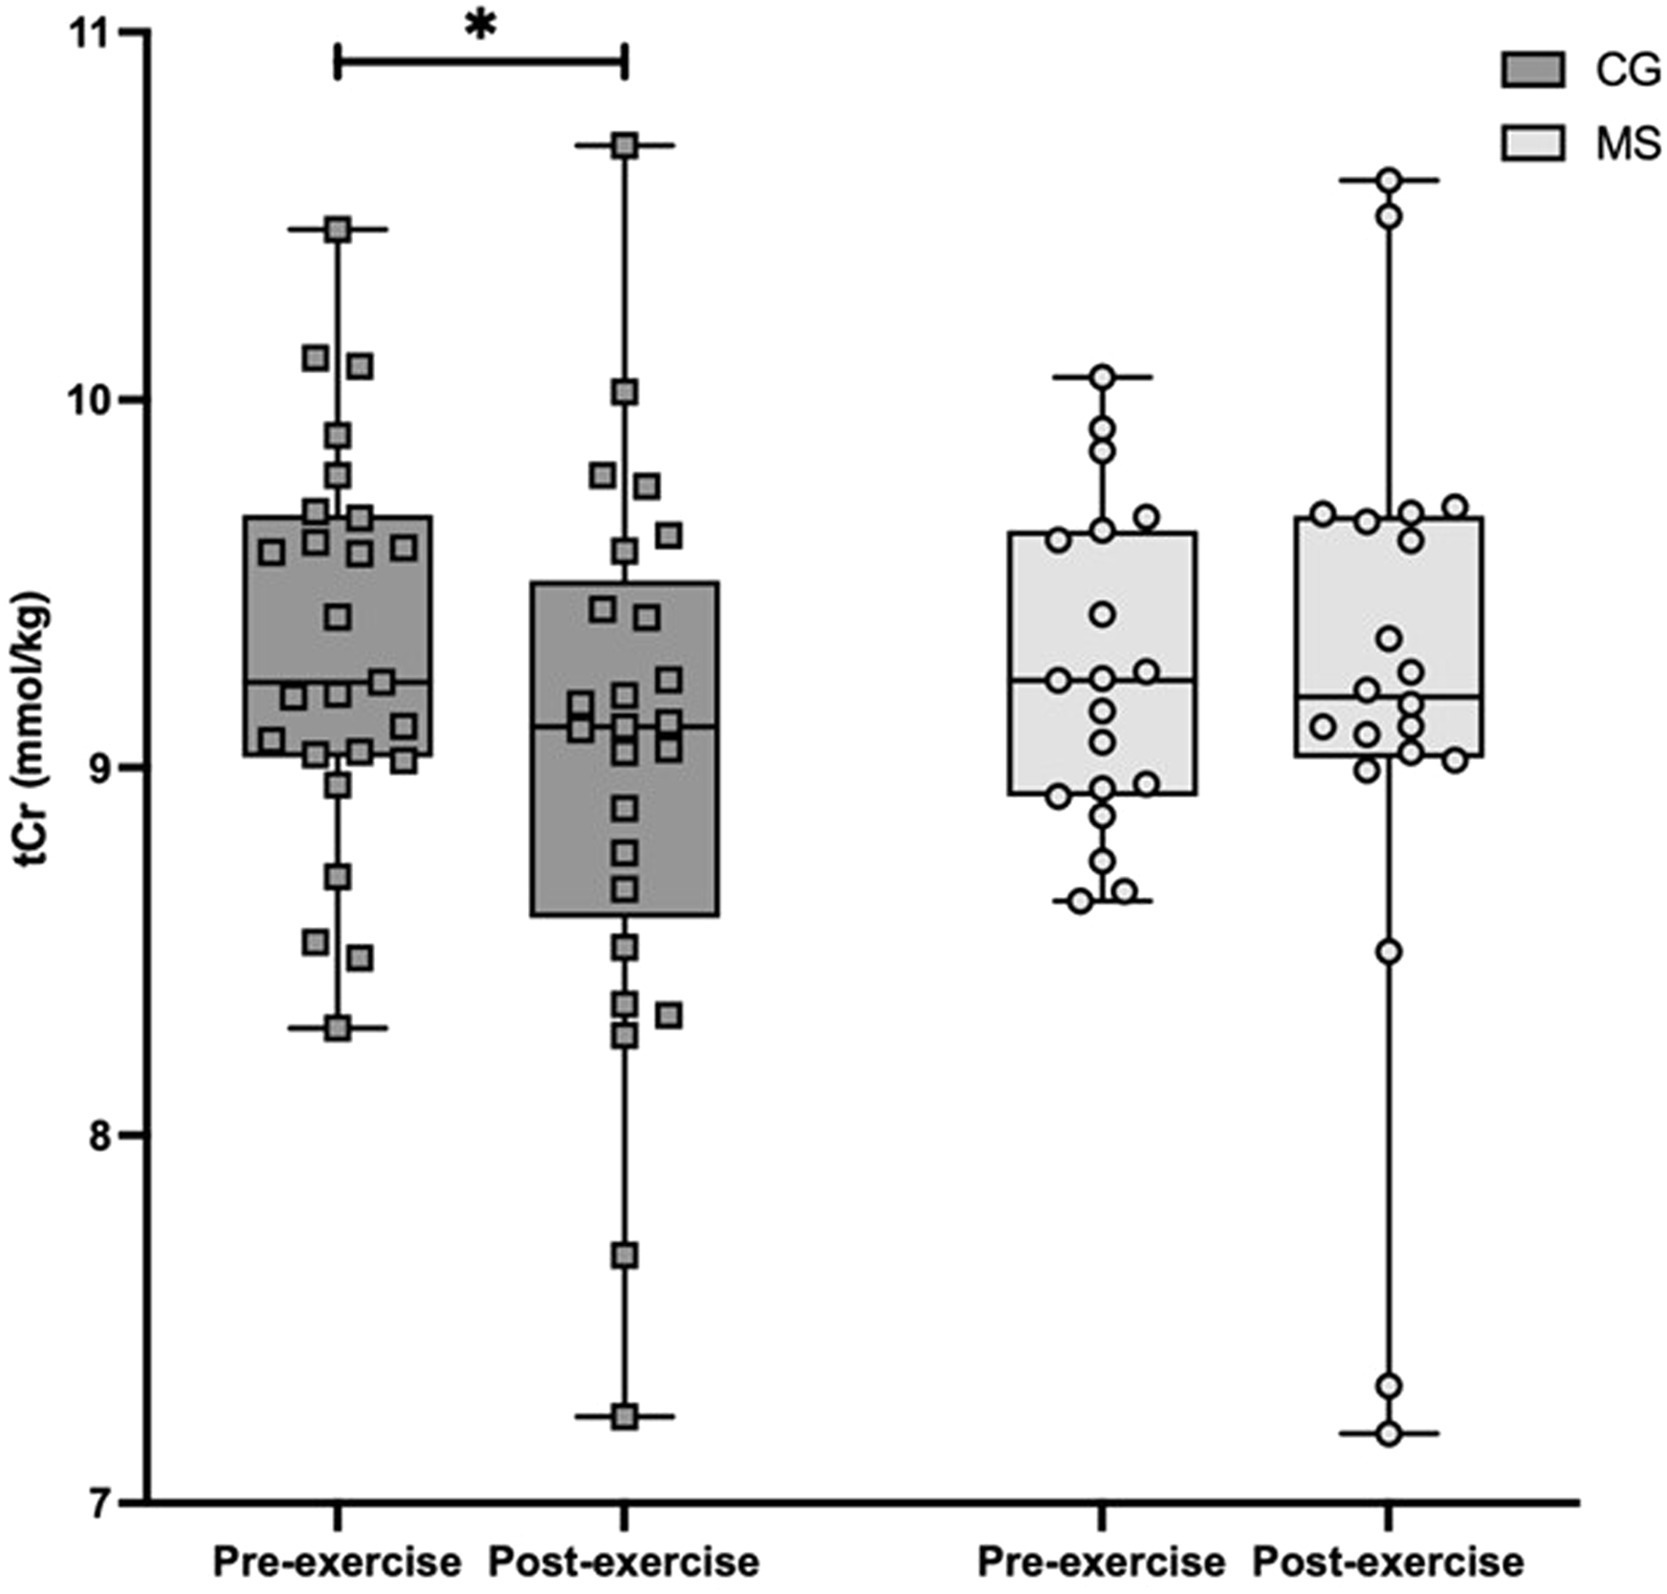
Total creatine in the anterior cingulate cortex before and after the task, controls on the left and patients on the right. The metabolite spectroscopy normally treats as a fixed internal reference fell in controls and held steady in patients. (Brownbill, et. al. (2026), Multiple Sclerosis and Related Disorders 112, 107339, Figure 4, CC BY 4.0)