

What MS Genetics Predicts After Diagnosis

Multiple sclerosis (MS) genetics has answered one question well. More than 230 susceptibility variants are mapped, most of them immune, and together they account for who develops the disease. They account for much less of what happens afterwards. Three 2026 studies take inherited variation to the questions that follow diagnosis: how fast disability accumulates, how cognition holds up, and how a first-line drug will be tolerated. All three find a real signal, and in all three the signal sits somewhere other than the clinical measurement built to capture it: a severity cluster that does not match the lesions, a disability allele that shows itself in people without the disease, and a drug reaction predicted by a score rather than by the blood test taken beforehand.
Three Genomic Clusters in 291 Brains
Abbadessa and colleagues worked with 291 donors from the UK MS Society Tissue Bank carrying genome-wide genotyping, clinical records and postmortem neuropathology together. Weighted genetic risk scores assigned each donor to one of three previously defined genomic clusters, 135 to cluster 1, 52 to cluster 2 and 104 to cluster 3, in proportions close to the original study. The clinical ordering reproduced. Cluster 2 had the shortest median time from onset to death, 27.5 years against 30.0 in the other two, a lower age-adjusted disease duration score than cluster 3 (β = -0.195, P = 0.023) and a shorter interval from progression to death than cluster 1 (β = -0.225, P = 0.049). Time to the progressive phase was the same across clusters, so what set cluster 2 apart was survival after progression rather than earlier conversion. Treatment did not explain it, since 91.2% of the donors with medication records had no documented therapy.
The Lesions Did Not Follow
The pathology ran the other way. Lesions were classified on myelin staining and on the density and distribution of HLA-D-positive microglia and macrophages, into active, chronic active with a broad rim, chronic active without one, and chronic inactive. Chronic active broad-rim lesions, the subtype read as ongoing smouldering inflammation, were most frequent in cluster 1 at 37.3%, against 24.0% in cluster 2 and 27.2% in cluster 3, both at FDR = 0.043. Chronic inactive lesions went the opposite way, 58.2% in cluster 1 against 70.0% and 73.8%. The clinically worst cluster carried the least rim pathology at death. Within each cluster, lesion burden still tracked severity in the expected direction, so the marker had not stopped working. Whatever the cluster 2 genetic profile captures is not held in end-stage lesion counts.
What the HLA Stain Is Measuring
The clustering framework is built partly on an HLA genetic burden score, which was highest in cluster 1. That score correlated with diffuse HLA-D immunoreactivity in tissue that was not lesional at all (Spearman ρ = 0.475), and the correlation held inside every cluster. It also correlated with pontine HLA-DRB1 (ρ = 0.514) and HLA-DRB5 (ρ = 0.740) transcript levels, and with lesion composition, giving more active and more broad-rim lesions and fewer chronic inactive ones. Carrying HLA-DRB1*15:01 was not associated with the severity score (P = 0.677). The authors state the consequence in their own limitations. Lesion activity in MS is conventionally scored by HLA-D staining, and if HLA-D expression varies with HLA genotype, the stain is not a genotype-independent readout of inflammation. Separating the two would need markers such as CD68, IBA1, TMEM119 or P2RY12.
A Severity Allele Tested Outside MS
Zimianiti and colleagues took rs10191329, the variant a genome-wide study of MS severity linked to long-term physical disability with heritability enrichment in central nervous system cells, and asked whether it touches cognition in people who do not have MS. In 399,031 UK Biobank participants of European genetic ancestry they compared 373,530 controls, 2,026 with MS, 1,466 with Parkinson's disease, 2,337 with dementia and 19,672 with migraine as a negative disease control. Within the MS group, carriers of two A alleles claimed a disability allowance more often than common-allele homozygotes, 52.4% against 46.5%, without reaching significance (OR 1.03, P = 0.15). In controls the A allele came with slower reaction time (0.01 SD per allele, P = 0.001), lower fluid intelligence (-0.02 SD per allele, P = 0.0004) and more errors on a prospective memory task (OR 1.06, P = 0.00002). Nothing else passed the study-wide threshold, although directions were consistent in MS, Parkinson's disease and dementia. Adding school leaving age as a covariate changed nothing, and the MS arm had 63% power for a 0.1 SD per-allele effect.
A Polygenic Score for a Side Effect
Kowalec and colleagues turned the same tool on tolerability. Roughly one in twenty people taking dimethyl fumarate develops severe lymphopenia. They built a polygenic score for lymphocyte count from UK Biobank data on over 400,000 individuals and tested it in 238 treated patients from Canada and Australia, with 156 from Sweden for replication. In the discovery cohort 72 had reached grade 2 lymphopenia, below 0.8 x 10⁹/L, and 34 had reached grade 3, below 0.5. One standard deviation of higher score carried a 57% lower hazard of grade 2 lymphopenia (HR 0.43, 95% CI 0.25 to 0.73, P = 0.002), and the effect held after adjustment for pre-treatment lymphocyte count (HR 0.48, P = 0.016), with the Swedish cohort directionally consistent. The genome-wide scan returned one significant variant on chromosome 9 that did not replicate, and across 18,051 genes none reached significance, the minimum gene-level FDR sitting near 0.34.
What the Three Share
Each study finds a real inherited effect and then finds the clinical instrument pointing elsewhere. Genomic severity clusters separate survival after progression but not end-stage rim lesion counts. A severity allele shows its clearest cognitive effect in people without the disease, where the sample is large enough to resolve 0.02 of a standard deviation. A score for a blood count predicts a drug reaction better than the blood count measured before treatment does. The shared requirement is scale: a biobank control arm in one study, a 400,000-person training set in another, and in the third a postmortem collection assembled over decades. The MS-specific estimates in all three come with wide intervals, which is what happens when the question moves from who gets the disease to what it does next.
Disclaimer: This blog post is based on the cited studies and is intended for informational purposes only. It is not intended to provide medical advice. Please consult with a healthcare professional for any health concerns.
References:
Abbadessa, G., Kreft, K. L., et al., Reynolds, R., & Nicholas, R. (2026). Genetic subtypes of multiple sclerosis severity are uncoupled from inflammatory lesion burden. Acta Neuropathologica, 152(1), 24. https://doi.org/10.1007/s00401-026-03062-x
Zimianiti, I., Waters, S., Harroud, A., Stridh, P., Dobson, R., & Jacobs, B. M. (2026). The multiple sclerosis severity allele rs10191329A and cognitive function: a UK Biobank study. Annals of Clinical and Translational Neurology, 13(10), 2143-2147. https://doi.org/10.1002/acn3.70458
Kowalec, K., Manouchehrinia, A., et al., Bernatsky, S., & Knox, K. B. (2026). Lymphocyte count polygenicity underlies dimethyl fumarate-associated lymphopenia in multiple sclerosis. Multiple Sclerosis Journal, 32(12), 1292-1301. https://doi.org/10.1177/13524585261471335
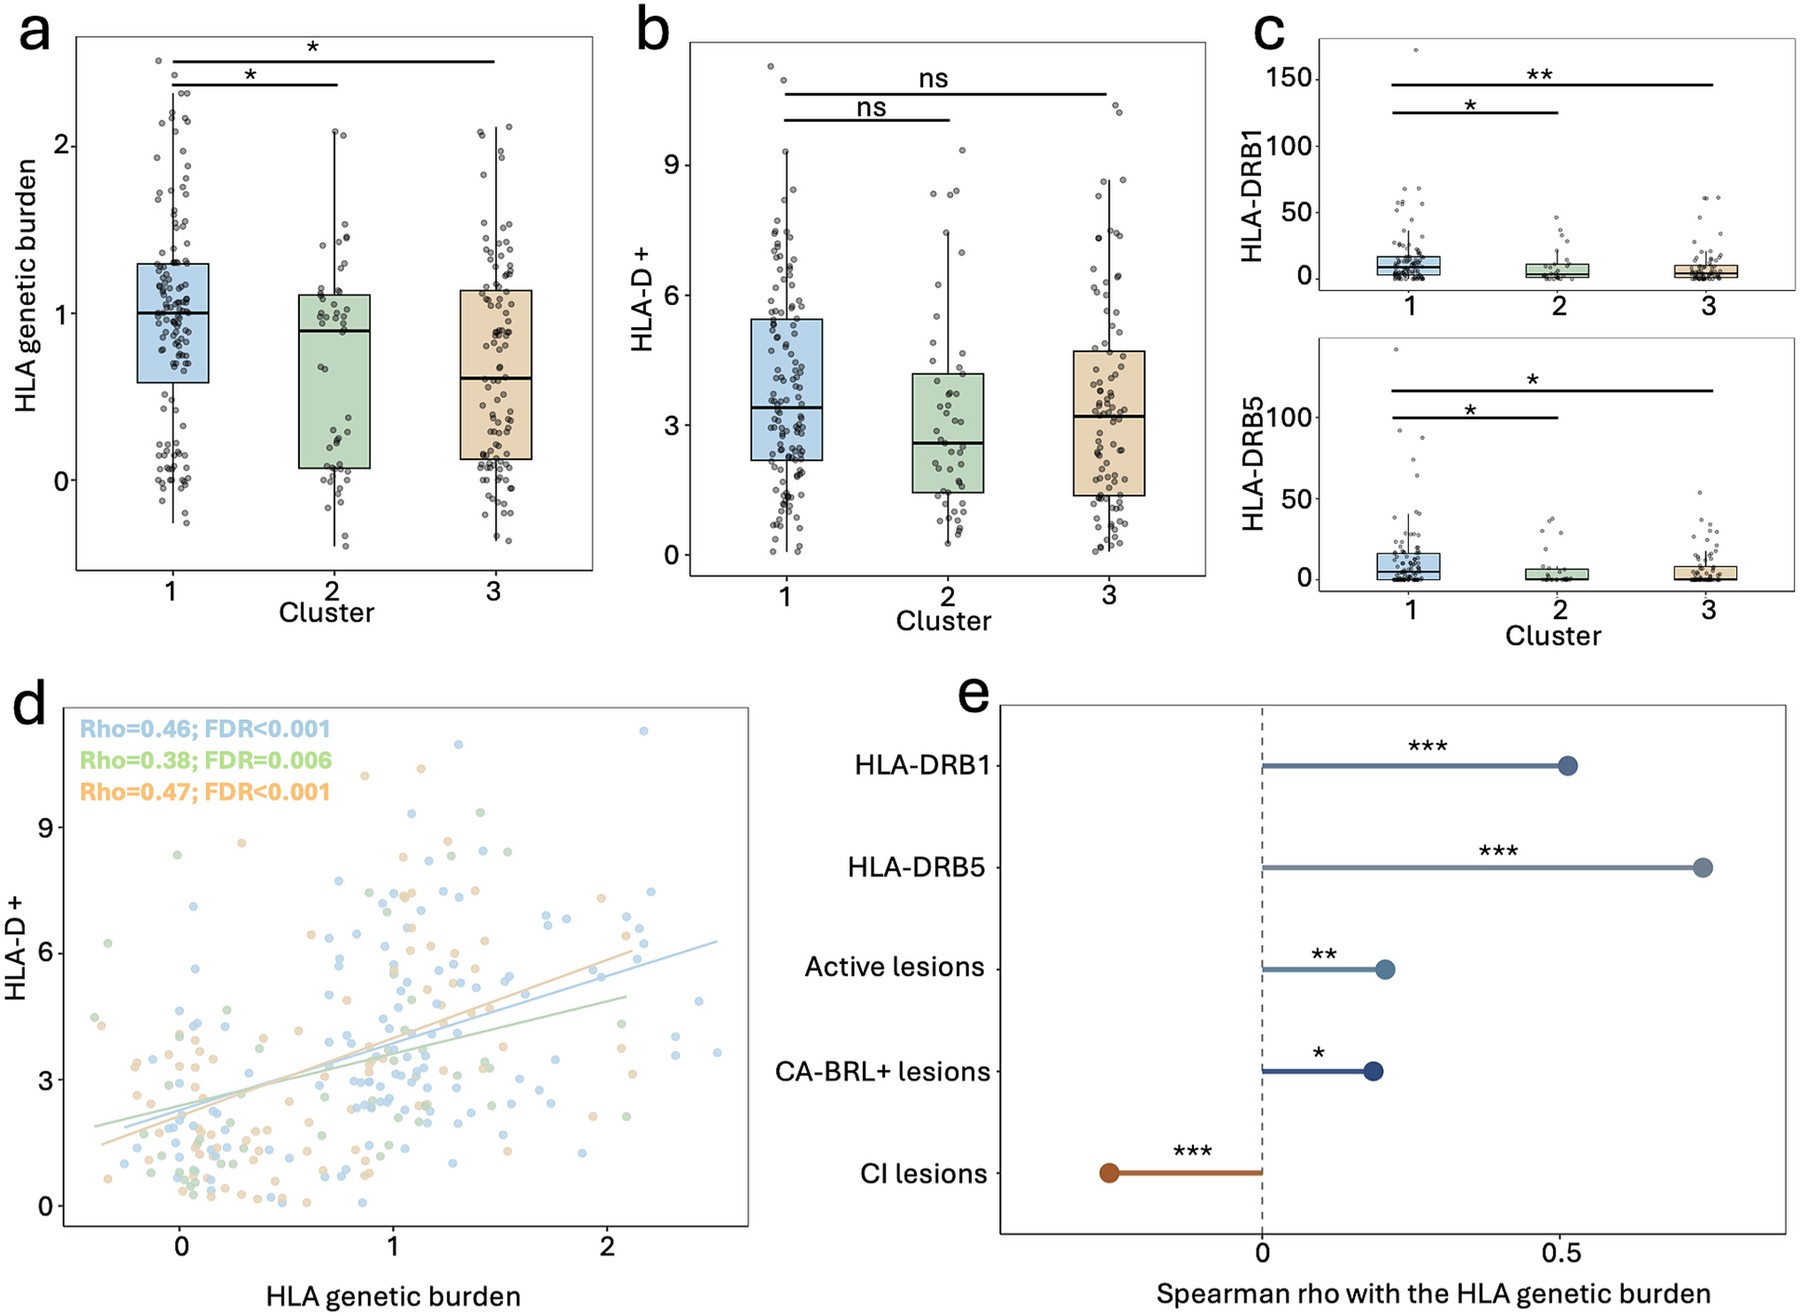
The axis that runs through the measurement: HLA genetic burden rises with non-lesional HLA-D staining, with HLA-DRB1 and HLA-DRB5 transcript levels, and with the inflammatory lesion subtypes scored using that same stain. (Abbadessa, et. al. (2026), Acta Neuropathologica 152(1), 24, Figure 2, CC BY 4.0)