

Metabolism in MS, Measured at Three Scales
Metabolism keeps turning up in multiple sclerosis (MS) research, and almost never at the same scale twice. It arrives as a body-weight measurement in an epidemiology cohort, as a few hundred small molecules in a blood sample, and as a set of enzyme reactions inferred from what a cell type transcribes. Those are three different objects with the same name, and they rarely meet in one study. Three recent papers measure one each, and reading them together shows where genotype enters and where it does not. The first asks whether obesity at diagnosis costs the same for everyone, the second asks which circulating molecules move with disability, and the third builds the metabolic network of five brain cell types from single-cell data and asks what MS does to it.
Obesity, but Mainly Without One Allele
Guo and colleagues followed 2,117 newly diagnosed MS patients from two Swedish population-based studies, all within five years of disease onset at inclusion and with HLA imputed at four-digit resolution, through the national MS registry. Obesity was body mass index above 30 at diagnosis. Among people lacking HLA-A*02:01, obesity came with a higher rate of confirmed disability worsening (HR 1.49, 95% CI 1.12 to 1.82), of reaching an Expanded Disability Status Scale score of 3 (HR 1.90, 95% CI 1.30 to 2.79) and of reaching 4 (HR 2.30, 95% CI 1.33 to 3.73). Among carriers of the allele, none of those associations appeared, and additive interaction analysis supported a joint effect. In the longitudinal models, obese patients without the allele sat highest from the first recorded disability score onwards, separating from the reference group at around seven years, with adjustment for age, sex, ancestry, phenotype, disease duration, baseline disability, smoking and first therapy class. Height and weight were self-reported and recorded only at diagnosis, and the authors call the mechanism speculative.
Three Hundred Molecules Against Six Kinds of Outcome
Siavoshi and colleagues moved the measurement into the bloodstream. They ran untargeted metabolomics on 541 plasma and serum samples from 323 people with MS, 71.9% of them relapsing-remitting, detecting 332 metabolites, and tested each against a wide set of outcomes rather than one. The list runs through disability score, walking speed, manual dexterity and processing speed, brain volumes from MRI, two retinal layer thicknesses from optical coherence tomography, and patient-reported measures covering disease steps, fatigue, anxiety, depression, sleep and cognition. Sample counts differ by domain, from 386 for the disability score down to 151 for the MRI volumes, and most outcomes were recorded within six months of the blood draw. Participants were spread across treatment, with 18.9% of samples taken off therapy and the rest split between low, moderate and high-efficacy drugs, so treatment is a variable in the background rather than a controlled condition. Between-person variation in the metabolome was larger than within-person variation, which is the condition any blood biomarker needs.
Which Molecules Moved With Disability
The molecules that tracked worse outcomes are mostly not made by human cells. P-cresol sulfate, p-cresol glucuronide, phenylacetylglutamine and trimethylamine N-oxide all come from gut bacteria processing aromatic amino acids, and all correlated with higher disability and thinner peripapillary retinal nerve fibre layer. Products of branched-chain amino acid breakdown ran the other way, as did tryptophan betaine, ergothioneine, N-acetylcarnosine and indolepropionate, which went with lower disability and better patient-reported scores. A separate cluster of medium-chain and long-chain acylcarnitines, the carriers that take fatty acids into mitochondria, correlated with worse cognitive performance. Pathway analysis grouped the signal into amino acid transport and metabolism, solute carrier systems, and bile acid, sphingolipid and carnitine pathways. The authors list external validation in independent cohorts as the next requirement.
Metabolism Rebuilt From Single-Cell Data
Sertbaş and Ülgen worked at the third scale. Starting from single-cell RNA sequencing of human brain and the global human reconstruction Human1, they used a task-driven inference algorithm to build genome-scale metabolic models for five cell types: iNeuron2527, iAstrocyte2303, iMicroglia1540, iOligodendrocyte2023 and iOPC1795, named for their gene counts. Adding transport reactions between them gave a combined model, iHumanBrain2690. Lipid metabolism held the largest number of reactions in every one of the five, and 4,565 reactions were shared across all of them. The models were then run under changes in glucose, ketone bodies and oxygen, where glucose raised glycolytic activity and ketone bodies raised the tricarboxylic acid cycle and oxidative phosphorylation, before being used to ask which metabolites the transcriptional changes in MS point at.
What the Models Point At in MS
Reporter metabolite analysis finds the metabolites whose surrounding enzymes shift most in expression. Run on microglia from MS, it returned 219 reporter metabolites in grey matter and 257 in white matter, with L-carnitine top in grey matter and arachidonate top in white. The 82 metabolites shared between the two regions were dominated by fatty acids, including adrenic, behenic, linoleic, palmitic and oleic acid. Over-representation put biosynthesis of unsaturated fatty acids at the front in grey matter microglia and cytochrome P450 xenobiotic metabolism in white matter. In oligodendrocytes from primary progressive MS the analysis gave 122 reporter metabolites, topped by carbamoyl-phosphate, acetate and ornithine, with enrichment in tyrosine, arginine and proline, glycolysis and gluconeogenesis, riboflavin and histidine metabolism. The oligodendrocyte list overlapped the microglial ones only slightly, 26 metabolites shared with grey matter and 11 with white, so the two cell types are being pushed in different metabolic directions inside the same disease.
What the Three Scales Have in Common
Carnitine species appear in two of the three, as acylcarnitines tracking worse cognition in patient blood and as the top reporter metabolite in grey matter microglia inferred from transcription. That is a coincidence of vocabulary rather than evidence, since one is a measured concentration in plasma and the other an enzyme-expression signature in a cell type, and no study here links them in the same person. The same gap runs through the set. Genotype is measured in the first paper and absent from the other two, metabolites are measured in the second and inferred in the third, and the cell type is identified only in the third, where no patient outcome exists. A design that closed the gap would need genotype, circulating metabolites and cell-level expression from the same cohort, which no study in this set has.
Disclaimer: This blog post is based on the cited studies and is intended for informational purposes only. It is not intended to provide medical advice. Please consult with a healthcare professional for any health concerns.
References:
Guo, J., Wu, J., Olsson, T., Alfredsson, L., & Hedström, A. K. (2026). Genetic modification of obesity-associated disability progression in multiple sclerosis. Journal of Neurology, 273(10), 578. https://doi.org/10.1007/s00415-026-14091-7
Siavoshi, F., Ladakis, D. C., et al., Fitzgerald, K. C., & Bhargava, P. (2026). Metabolomic profiles associated with disease severity in multiple sclerosis. Neurology Neuroimmunology & Neuroinflammation, 13(6), e200664. https://doi.org/10.1212/NXI.0000000000200664
Sertbaş, M., & Ülgen, K. Ö. (2025). Exploring human brain metabolism via genome-scale metabolic modeling with highlights on multiple sclerosis. ACS Chemical Neuroscience, 16(7), 1346-1360. https://doi.org/10.1021/acschemneuro.5c00006
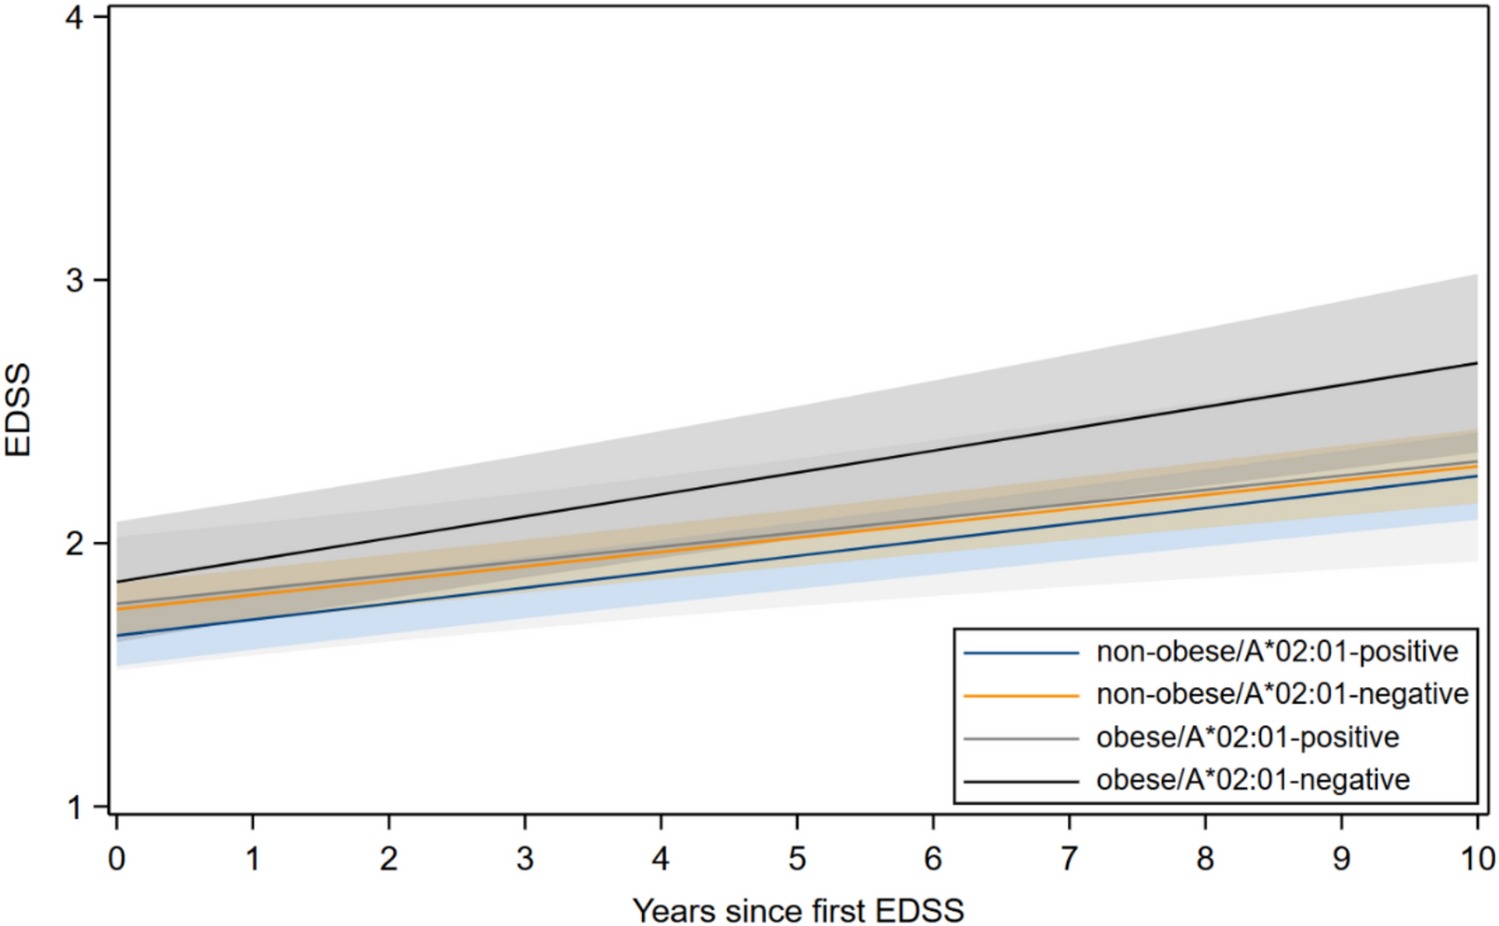
Ten years of predicted disability in four groups. Obese patients lacking HLA-A*02:01 run highest and keep separating, while the other three tracks stay together. (Guo, et. al. (2026), Journal of Neurology 273(10), 578, Figure 2, CC BY 4.0)